
Weekly Index Highlights, September 1, 2025
Markets pulled back sharply this week, with all major capitalization indices down more than 3%. Solana was the only major token to post gains. Bitcoin’s implied volatility spiked, with the CF BVXS up 12.5%, while put-side IV rose as hedging activity and downside protection demand picked up.

Market Performance Update
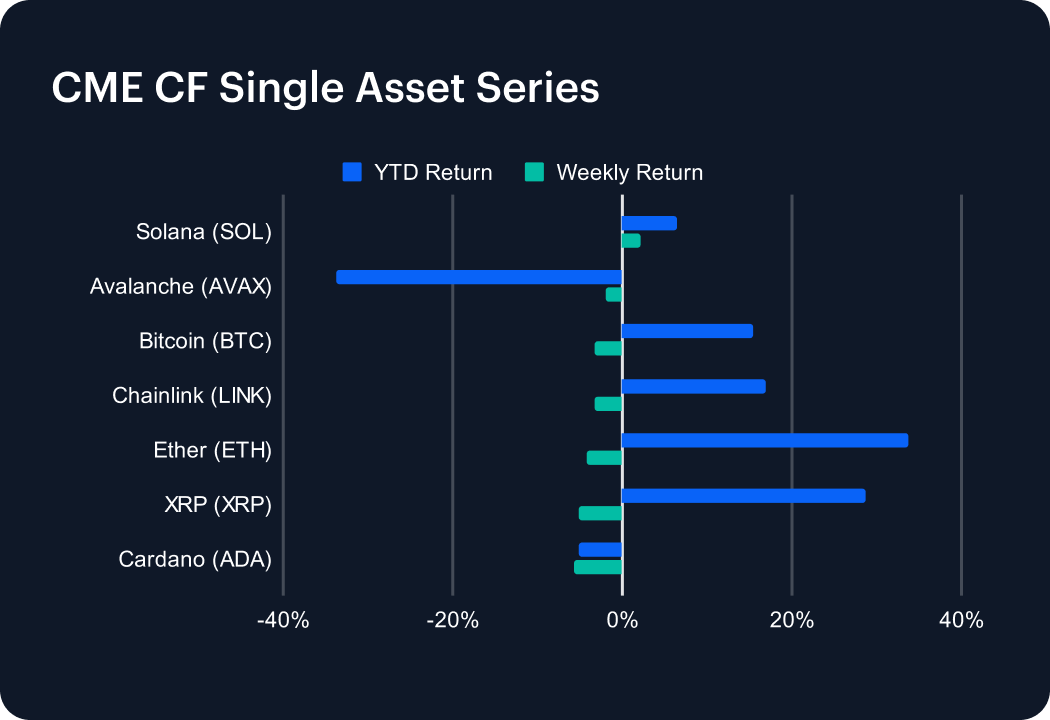
In a turbulent trading week, altcoins broadly struggled, reversing recent momentum. Solana managed a modest 2.23% rise, nudging its year-to-date return to 6.39%, while Avalanche slipped 2.02%, deepening its losses to –33.69% YTD. Bitcoin retreated 3.22%, cutting its 2025 gain to 15.35%, and Chainlink fell 3.32%, leaving it with a slimmer 16.95% advance. Ether endured the sharpest decline among majors, sliding 4.20%, though it still holds a commanding 33.78% gain for the year. XRP dropped 5.06%, easing back to a 28.73% YTD return. Cardano fared worst, tumbling 5.66% to bring it into negative territory at –5.22% for 2025, underscoring the uneven pressure across the altcoin landscape.
Sector Analysis
The DACS landscape turned more uneven, with leadership shifting sharply across categories. In Finance, Trading saw fireworks from Loopring (+20.81%), vaulting well above the –2.16% sub-category average, while Curve (–8.89%) and Balancer (–6.57%) dragged the cohort. Borrowing & Lending stayed pressured, with Compound (–3.66%) and Spell (–6.55%) exhibiting weakness. Programmable Settlement fared worse, despite Solana’s gain (+2.23%), the sub-category averaged –4.30% as HBAR (–7.01%), Algorand (–9.60%), and Tezos (–10.49%) exhibited continued weakness. Non-Programmable Settlement also slipped, with Litecoin (–1.54%) exhibiting relative strength as XRP (–5.06%) and Stellar (–9.70%) weighed on the sub-category. Infrastructure stood out as Polygon surged 14.21%, easily eclipsing a –2.15% average, while Arbitrum (–8.56%) marked sharp underperformance. In Culture, LPT (+11.79%) and BONK (+6.60%) staged impressive rallies, while PRIME (–12.30%) and SUPER (–8.00%) lagged.
CF Staking Series
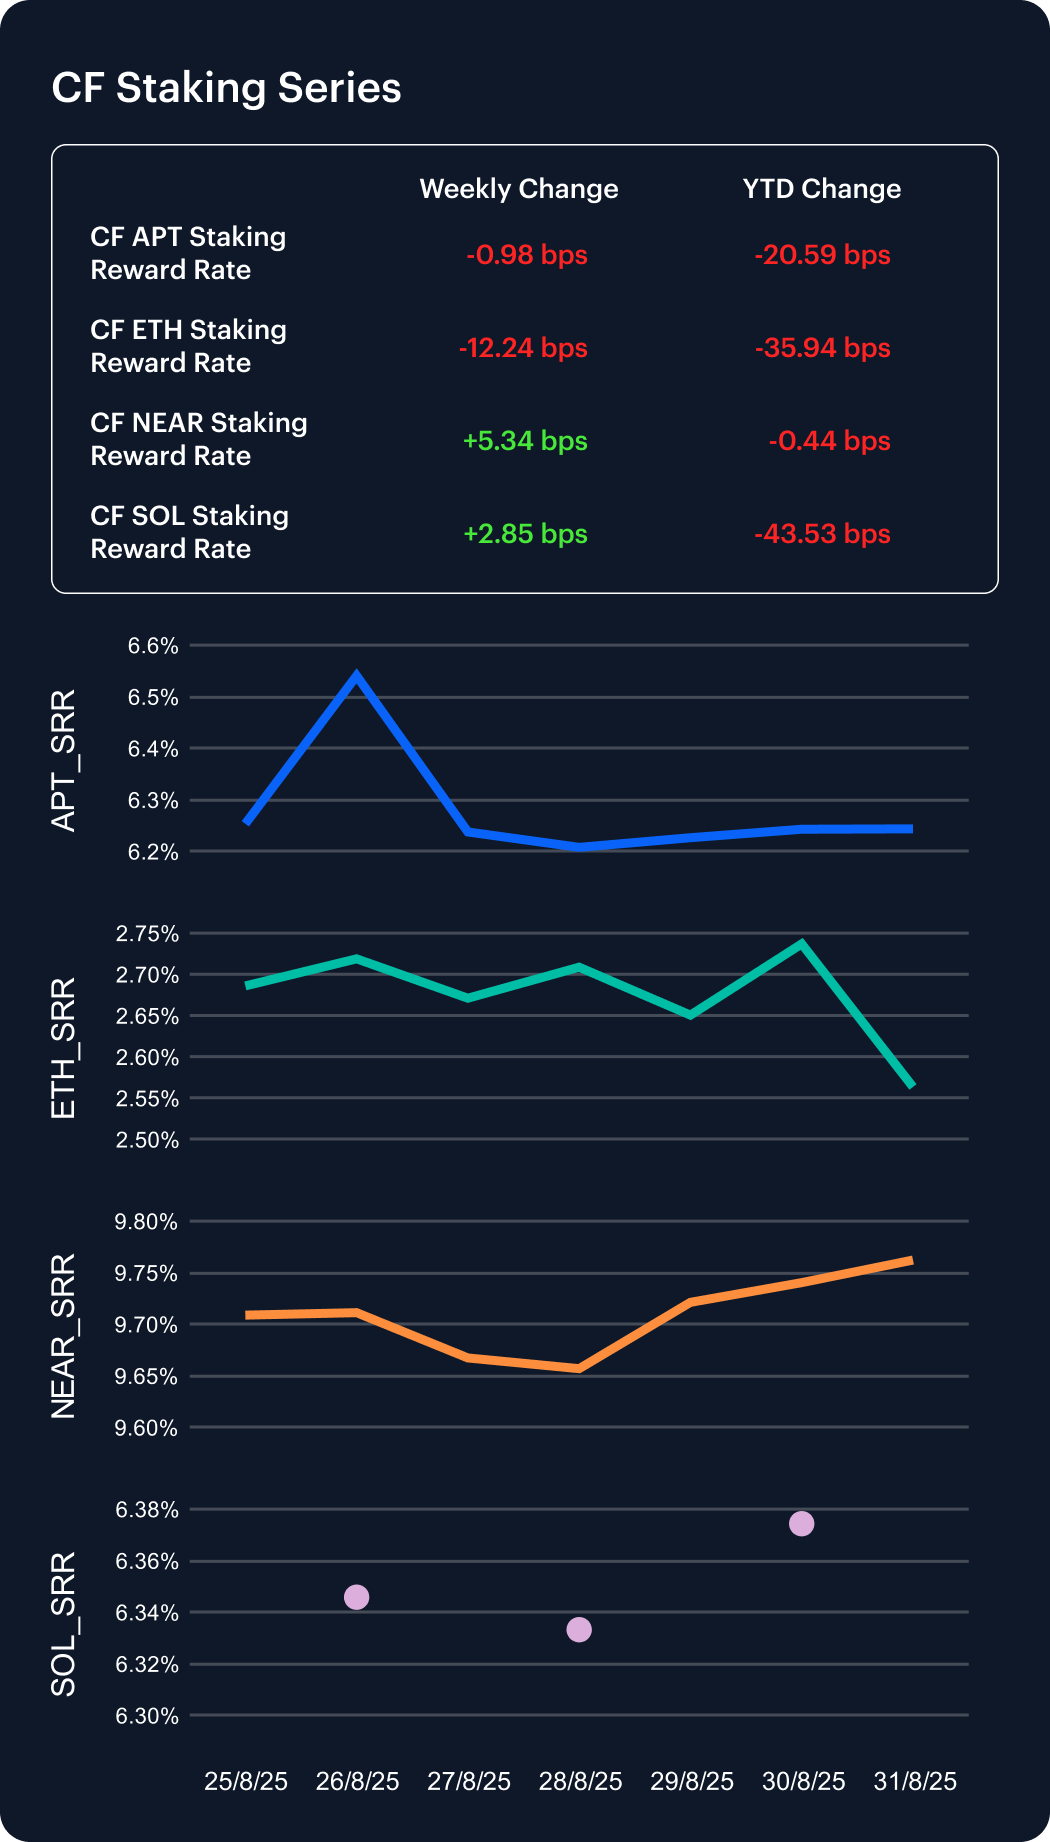
Despite a range of weekly moves, all major staking reward rates remain lower on the year. NEAR once again stood out, its annualized reward rate rising 5.34 bps to 9.76%, leaving its year-to-date decline at just –0.44 bps (–0.05%). Solana also firmed, gaining 2.85 bps to 6.37%, though its cumulative 43.53 bps erosion keeps it one of 2025’s weaker performers at –6.39%. Aptos remained subdued, slipping 0.98 bps to 6.24% and extending its YTD decline to –20.59 bps (–3.19%). Ethereum was the clear laggard, falling 12.24 bps to 2.56%, deepening its annual decrease to –35.94 bps (–12.29%), the sharpest among majors. The dispersion underscores how validator economics remain uneven.
Market Cap Index Performance
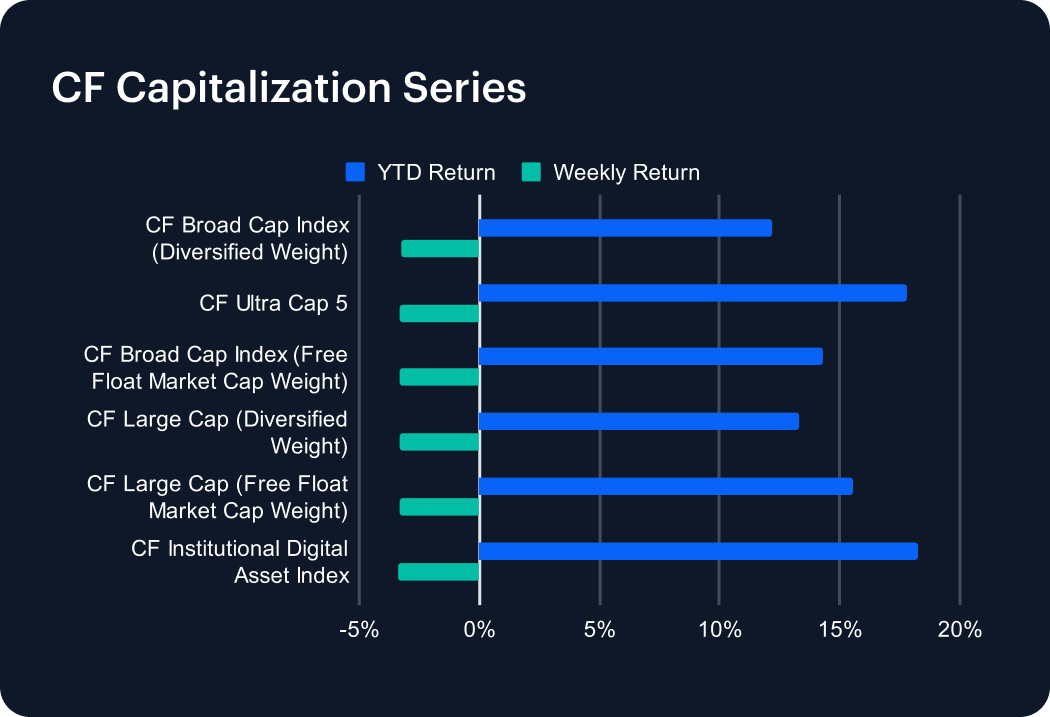
Momentum faltered in the CF Capitalization Series last week, as all major benchmarks slipped into negative territory. The CF Broad Cap (Diversified Weight) declined 3.26%, trimming its 2025 gain to 12.16%, while the CF Large Cap (Diversified Weight) fell 3.30% but still holds a 13.28% advance year-to-date. Free-float measures moved in tandem, with the CF Broad Cap Index off 3.29% (YTD 14.28%) and the CF Large Cap (Free Float) down 3.31%, leaving it up 15.57% for the year. Among flagships, the CF Ultra Cap 5 retreated 3.29%, yet retains a robust 17.78% advance in 2025. The CF Institutional Digital Asset Index lagged slightly, sliding 3.40%, though it remains the top performer with an 18.25% annual gain.
Classification Series Analysis
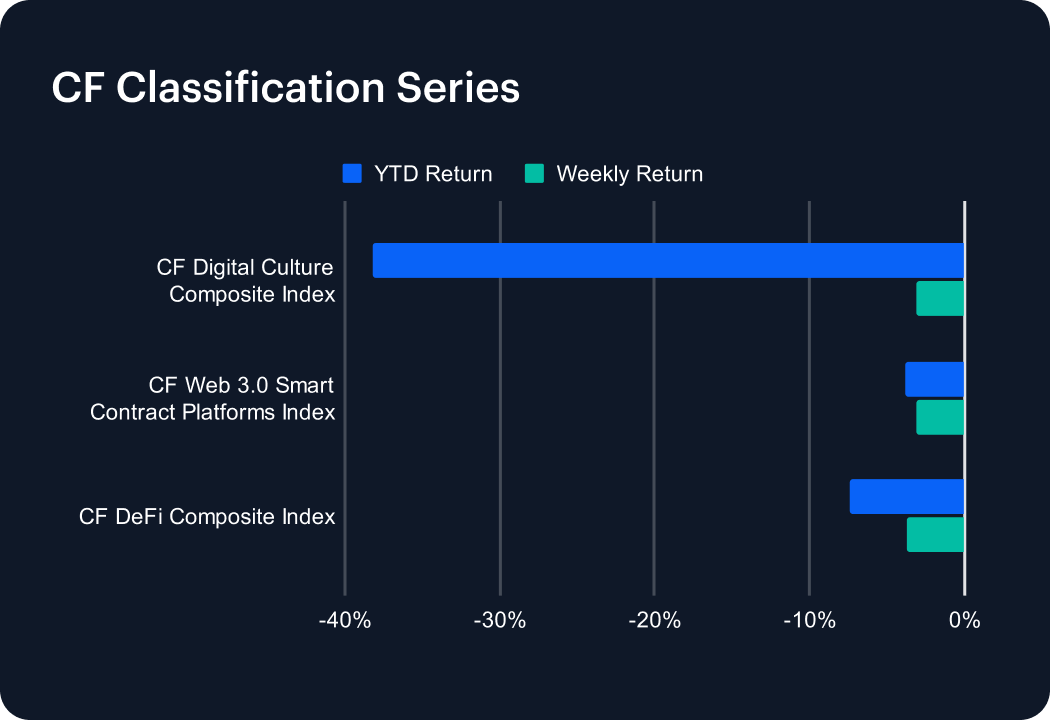
Last week brought renewed weakness across the CF Classification Series, as risk-sensitive sectors struggled to sustain momentum. The CF Digital Culture Composite Index slipped 3.12%, deepening its year-to-date decline to –38.19% and underscoring persistent headwinds in high-beta tokens. The CF Web 3.0 Smart Contract Platforms Index fell 3.16%, dragging its 2025 return further into negative territory at –3.84%. The CF DeFi Composite Index posted the steepest pullback, dropping 3.72% to leave it down –7.45% year-to-date. The declines highlight how speculative themes remain under pressure, with conviction across digital asset verticals still fragile.
Volatility
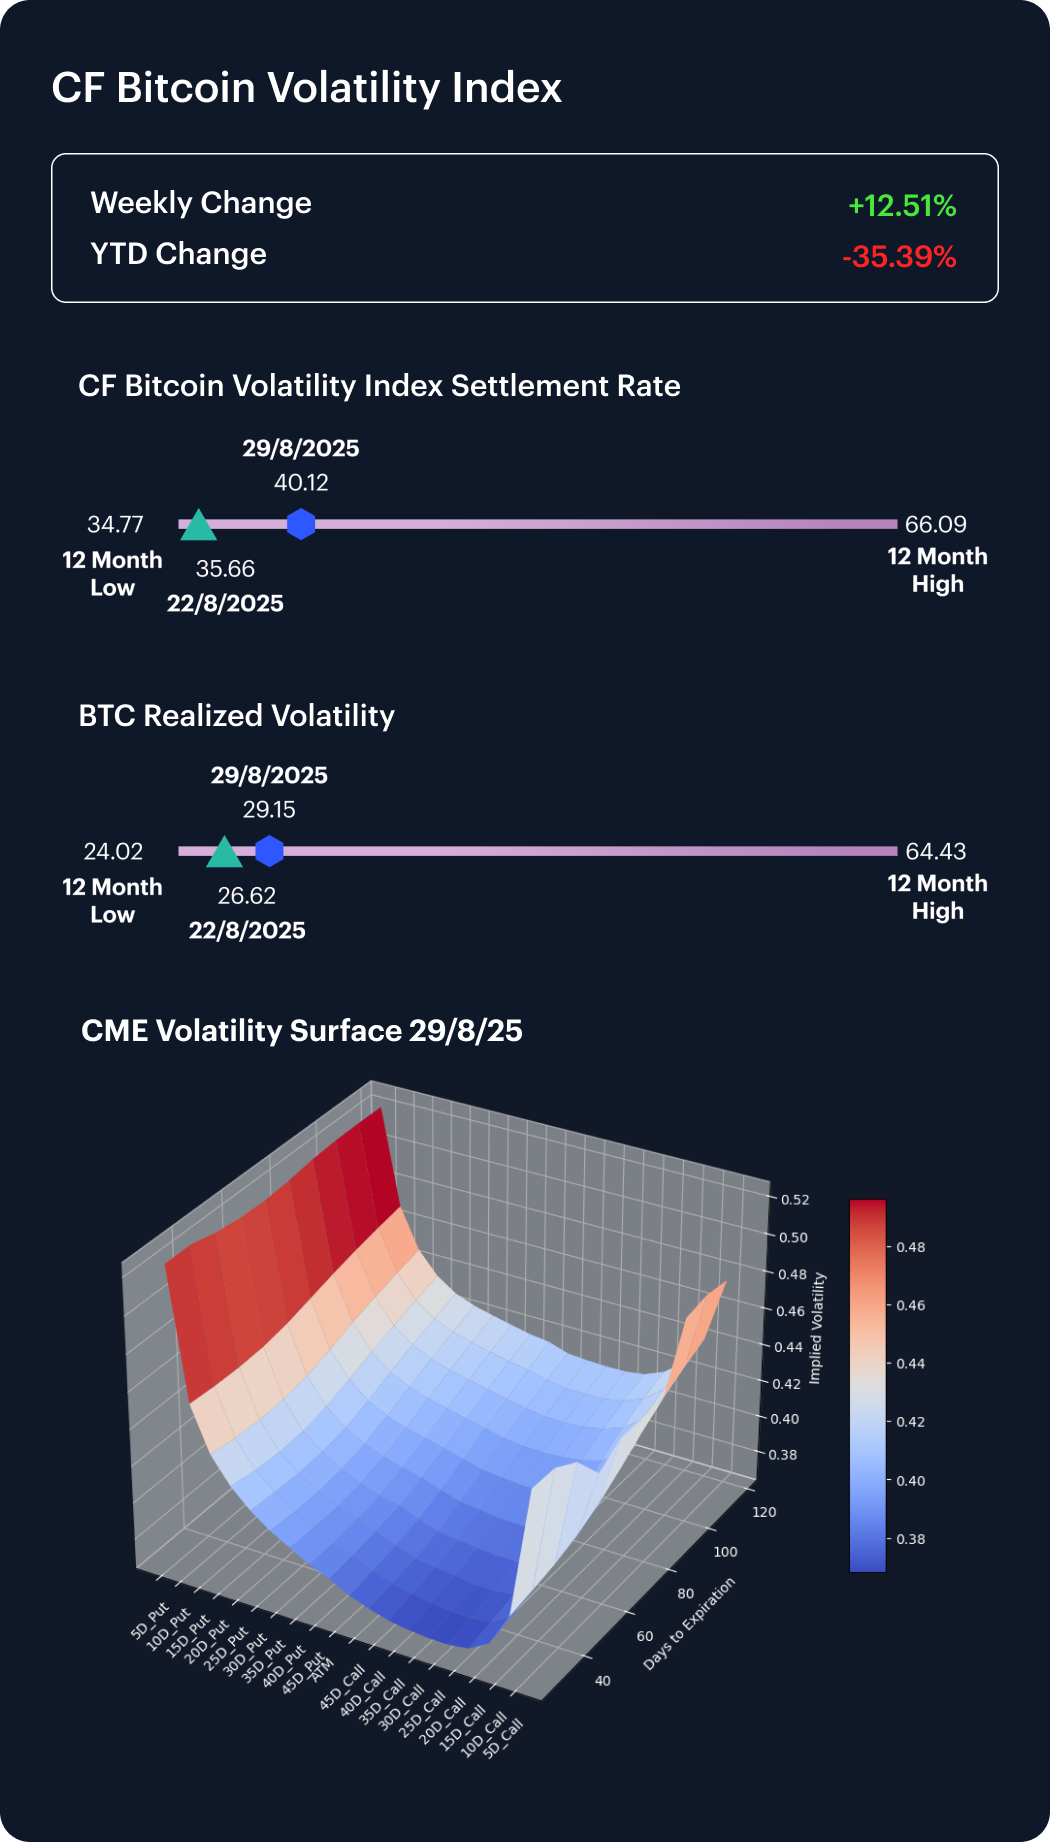
The CF Bitcoin Volatility Index Settlement Rate (BVXS) surged 12.51% last week, climbing from 35.66 to 40.12, though it remains 35.39% below its January level and still above the 12-month low of 34.77. Realized volatility tracked higher in tandem, rising from 26.62 to 29.15, reinforcing the recent convergence between implied and spot measures. Beneath the surface, skew shifted further into negative territory, as demand for downside protection increased and 5-delta put implied volatility rose meaningfully across maturities. Convexity also expanded, leaving short-dated options softer while longer-dated structures continue to embed heavier tail risks. The overall setup reflects persistent caution, with markets recalibrating around asymmetric downside despite relatively contained realized volatility.
Interest Rate Analysis
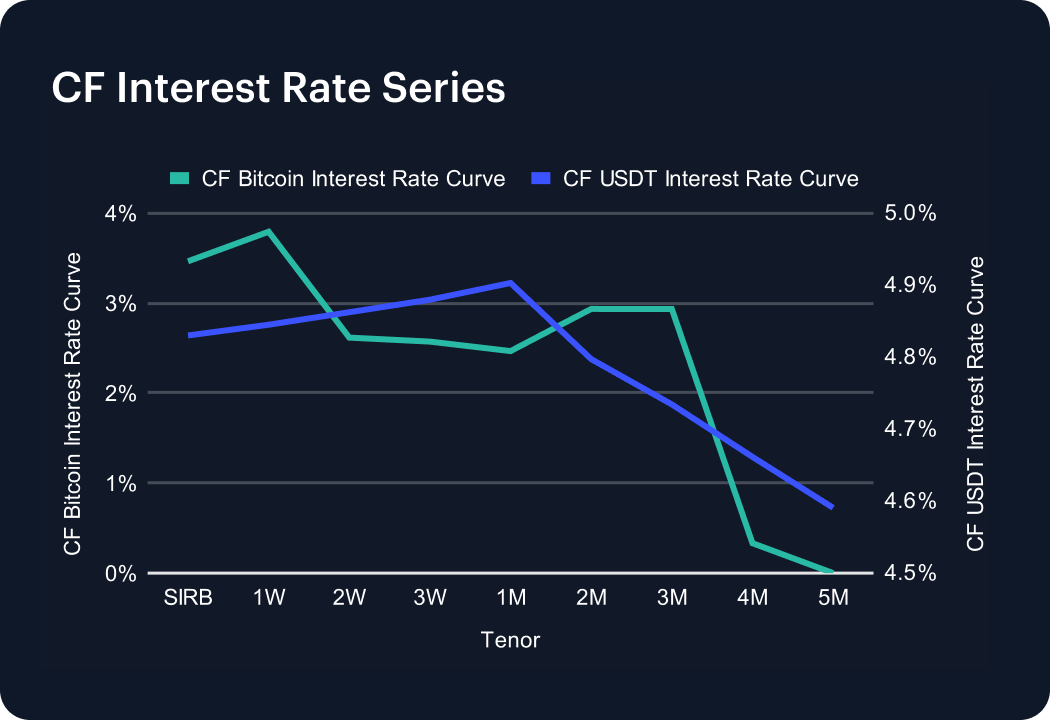
USDT funding remained firm, with the curve holding between 4.83% and 4.90% across the front end before easing steadily to 4.59% at five months. While well below prior 8% prints, the structure stays modestly downward-sloping, reflecting persistent demand for stablecoin liquidity even as borrowing costs normalize. The front-end premium highlights appetite for immediate USDT access, while softer levels further out suggest expectations for gradual easing. By contrast, the Bitcoin funding curve weakened further, slipping from 3.79% at one week to near zero beyond four months, underscoring the differentiated role of stablecoins as leverage collateral relative to BTC.
The information contained within is for educational and informational purposes ONLY. It is not intended nor should it be considered an invitation or inducement to buy or sell any of the underlying instruments cited including but not limited to cryptoassets, financial instruments or any instruments that reference any index provided by CF Benchmarks Ltd. This communication is not intended to persuade or incite you to buy or sell security or securities noted within. Any commentary provided is the opinion of the author and should not be considered a personalised recommendation. Please contact your financial adviser or professional before making an investment decision.