
Weekly Index Highlights, October 27, 2025
Digital assets rebounded week-on-week, led by XRP and SOL. Sector gains broadened across CF DACS cohorts, while staking indices diverged. Capitalization tiers advanced, volatility eased, and BTC/USDT curves normalized. Our CF Factor Data signaled Liquidity and Growth styles were mildly favored.

Market Performance Update
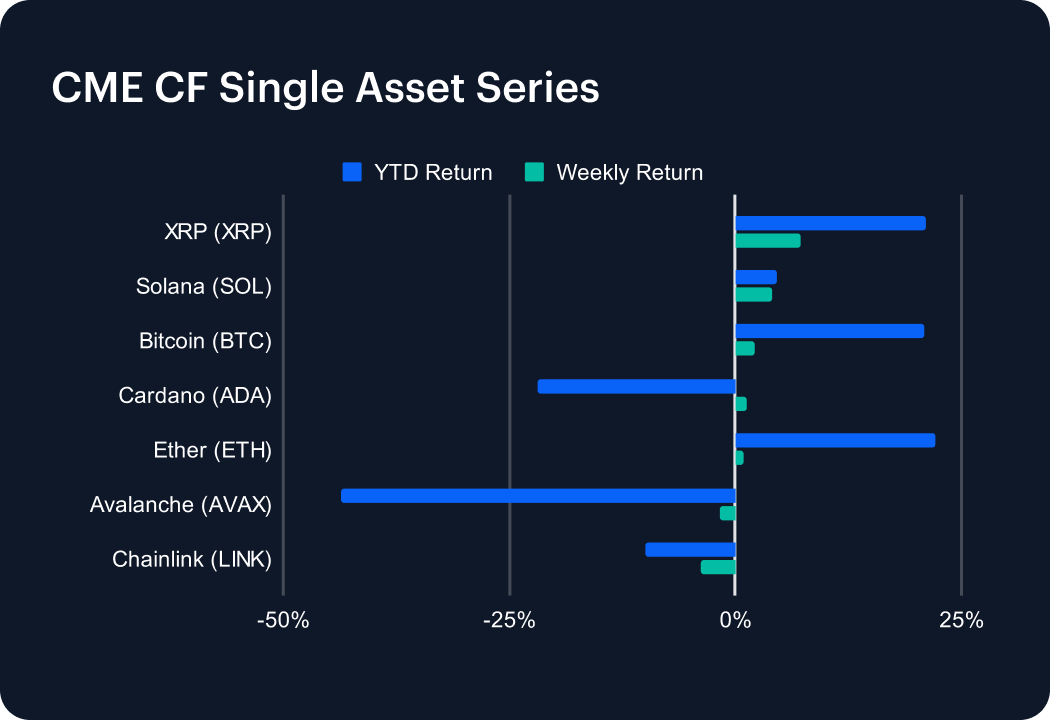
Large-caps have clawed back some ground after two weeks of losses, marking a steadier close to October. Within the CME CF Single Asset Series, XRP (XRP) led with a +7.29% gain in the most recent week, leaving the token with a +21.02% year-to-date return; followed by Solana (SOL) +4.01% (YTD +4.59%) and Bitcoin (BTC) +2.17% (YTD +20.82%). Cardano (ADA) and Ether (ETH) also advanced, +1.33% and +0.88%, consolidating mid-month support. Among assets less favored, Avalanche (AVAX) continued lower, losing −1.78%, and Chainlink (LINK) tanked further −3.79%. The rotation back toward higher-liquidity majors leaves breadth constructive, though participation remains uneven. Overall, we saw what looked like a corrective rally over the week, rather than renewed ‘risk-on’.
Sector Analysis
Through the CF Digital Asset Classification Structure (CF DACS) lens, performance improved week-on-week, with clear leaders and laggards across segments. Standout gains included Bitcoin Cash (BCH) +13.26%; APE, in Culture’s Social segment, +7.49%, and in Finance, BAL, a Trading token, was up +6.80%. Among General Purpose Smart Contract Platforms, APT rose +6.45%; with SOL +4.01%. Computing token HNT gained +6.24%; while PRIME, in Gaming, added +4.18%. Laggards were concentrated in higher-beta cohorts: SNX, a Derivatives protocol, nosedived −26.90%; BAT (VR & AR, in Culture) shed −10.46%; while FET (Computing; Infrastructure) was another loser, −5.53%. The overall profile for the week was orderly rather than disorderly. Breadth broadened on the upside (notably in Store Of Value & Payment and Smart Contract Platforms) while the week’s heaviest declines clustered in Derivatives, Scaling, and select Culture segments.
CF Staking Series
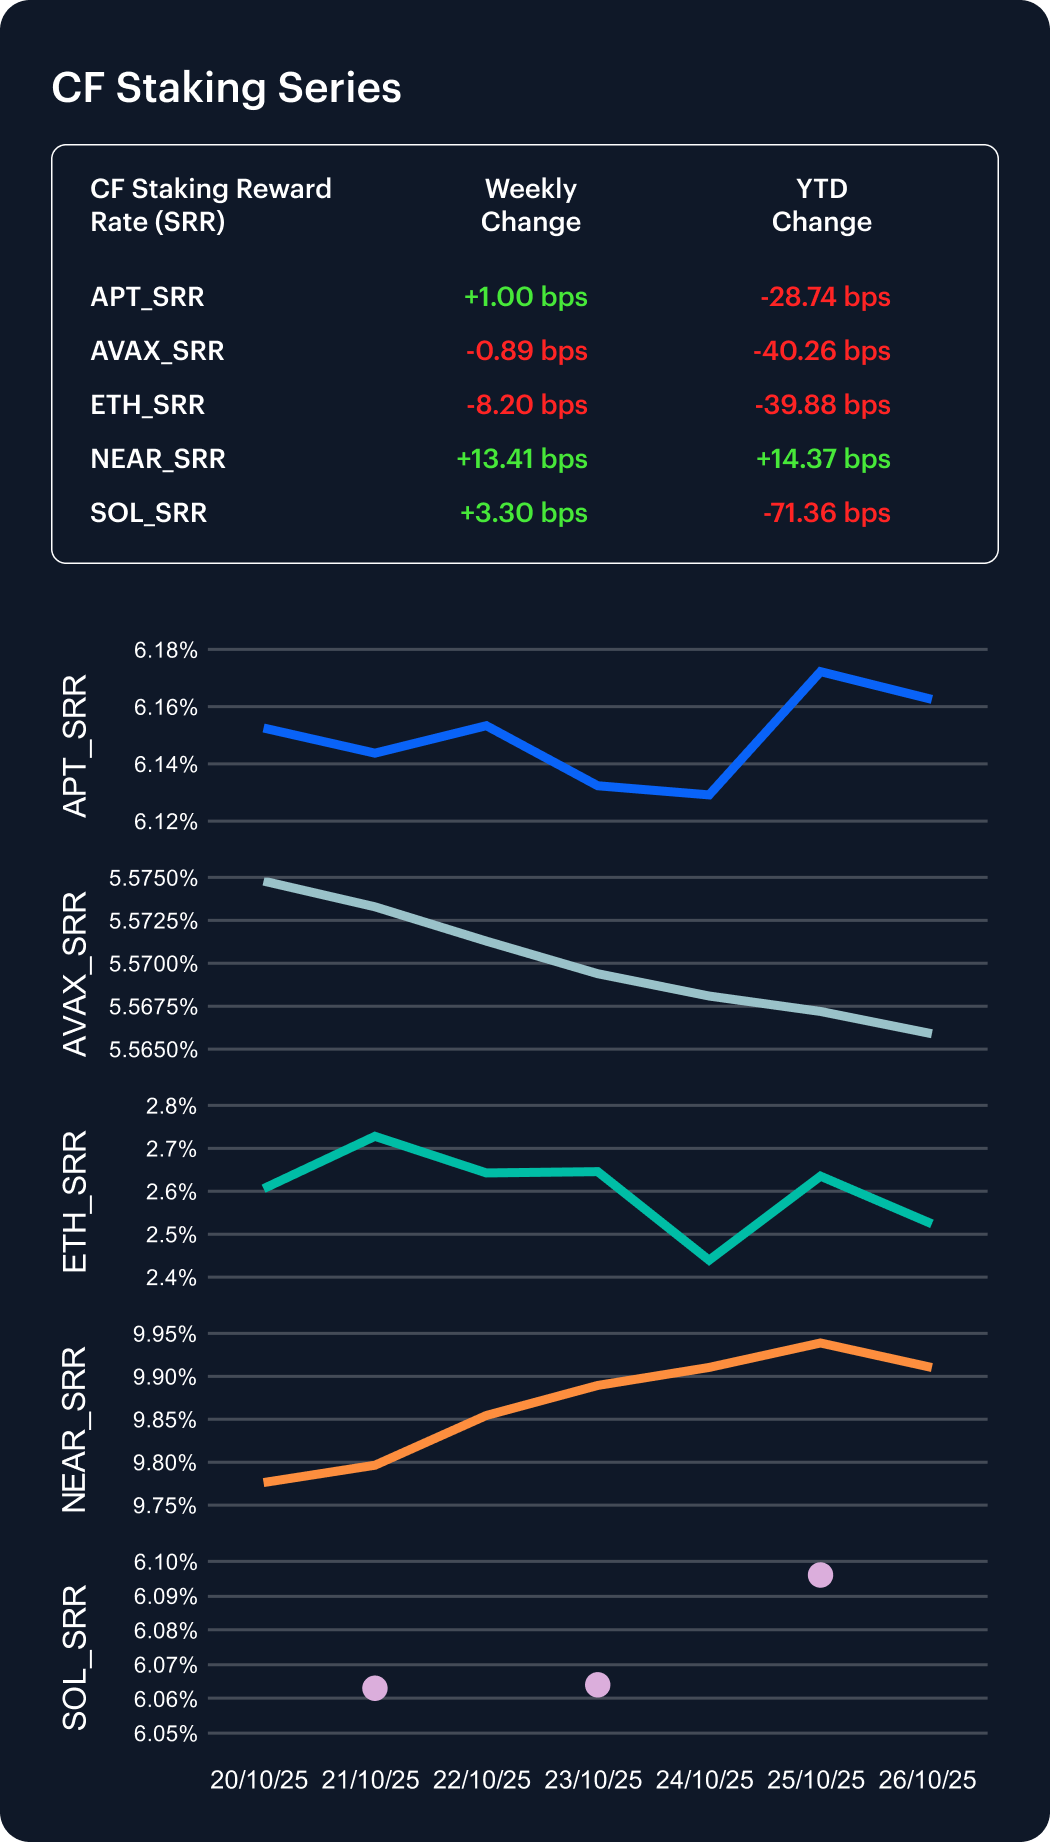
Staking indices were once again mixed week-on-week. APT staking edged slightly higher, +0.16% (+1.00 bps); AVAX staking edged slightly lower, −0.16% (−0.89 bps). SOL gained a little more, +0.54% (+3.30 bps), and NEAR gained +1.37% (+13.41 bps). Meanwhile, ETH staking was the laggard, with a definitive decline, −3.15% (−8.20 bps). Year-to-date readings stand as follows: APT −4.46% (−28.74 bps), AVAX −6.75% (−40.26 bps), ETH −13.64% (−39.88 bps), NEAR +1.47% (+14.37 bps), SOL −10.48% (−71.36 bps). Net read-through for the most recent week suggests carry expanded for NEAR and SOL, was flat-to-softer for APT and AVAX, and was most compressed for ETH.
Market Cap Index Performance
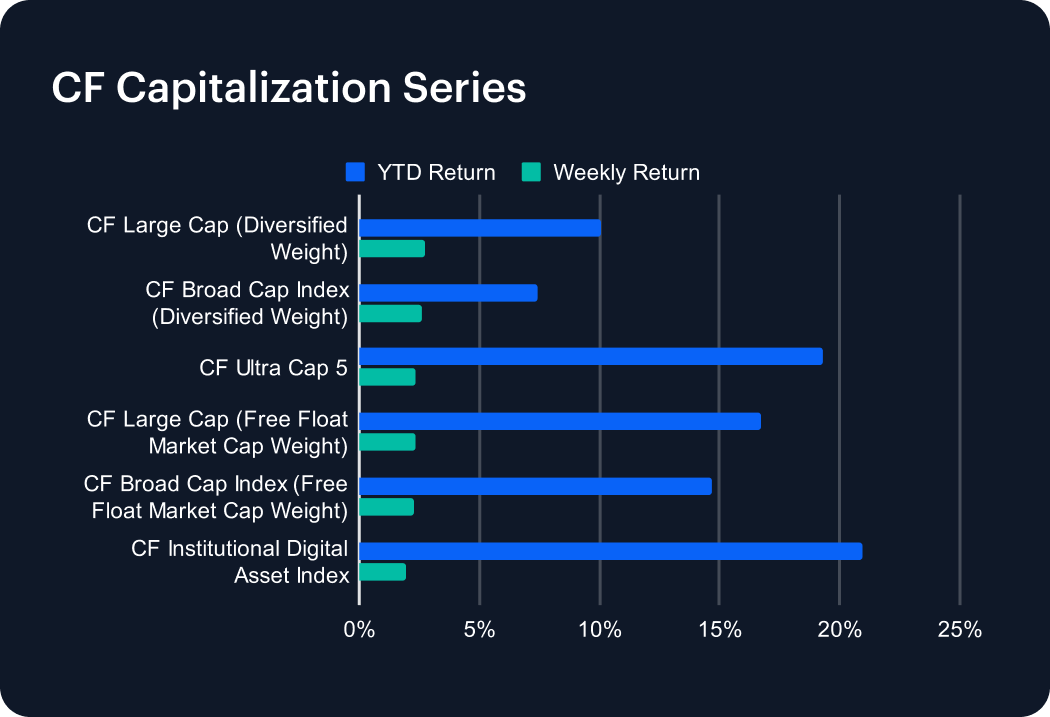
The CF Capitalization Series advanced week-on-week across all tiers, extending October’s recovery. CF Large Cap (Diversified Weight) rose +2.73% (YTD +10.08%), while CF Broad Cap Index (Diversified Weight) gained +2.58% (YTD +7.43%). CF Ultra Cap 5 climbed +2.36% (YTD +19.27%), and CF Institutional Digital Asset Index increased +1.96% (YTD +20.91%). Free-float market-cap variants moved in parallel: CF Large Cap (Free Float Market Cap Weight) +2.33% (YTD +16.74%) and CF Broad Cap Index (Free Float Market Cap Weight) +2.29% (YTD +14.67%). The uniformity of gains underscores systematic inflows across capitalization tiers and renewed liquidity concentration among the highest-weighted constituents.
Classification Series Analysis
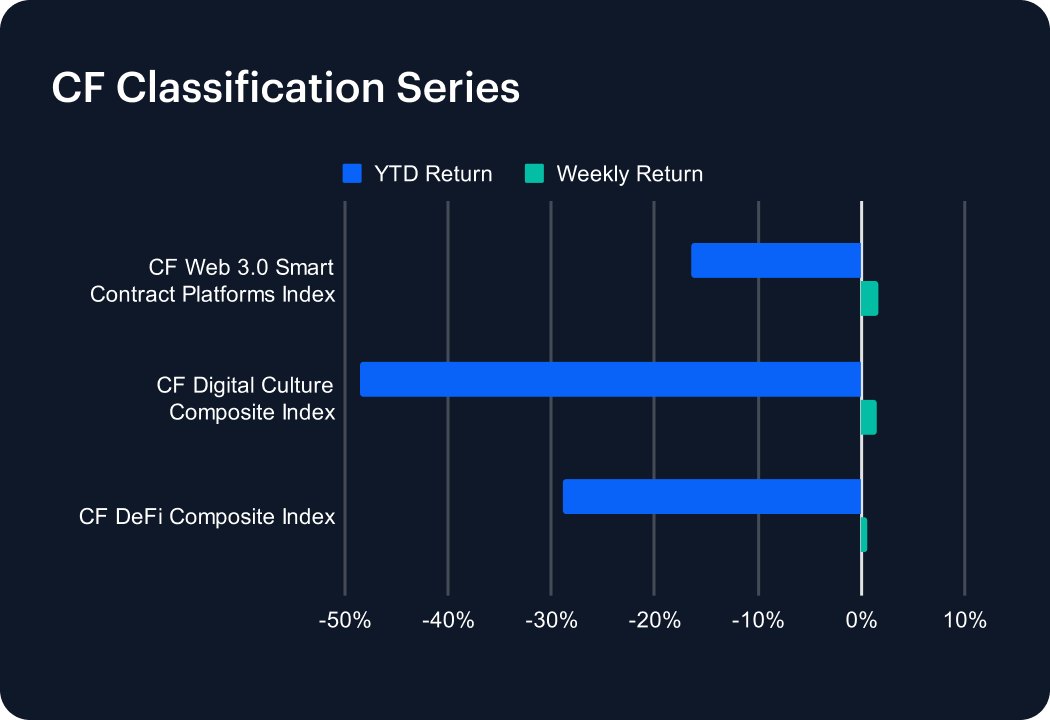
The CF Classification Series advanced modestly week-on-week. CF Web 3.0 Smart Contract Platforms Index gained +1.57% (YTD −16.51%), CF Digital Culture Composite Index rose +1.42% (YTD −48.61%), and CF DeFi Composite Index added +0.61% (YTD −28.97%). The rebound was led by Smart-Contract Platforms and Culture, while DeFi lagged slightly. The pattern echoes prior recovery phases, where utility-oriented themes stabilize first, followed by slower rotation into liquidity-sensitive cohorts.
Volatility Analysis
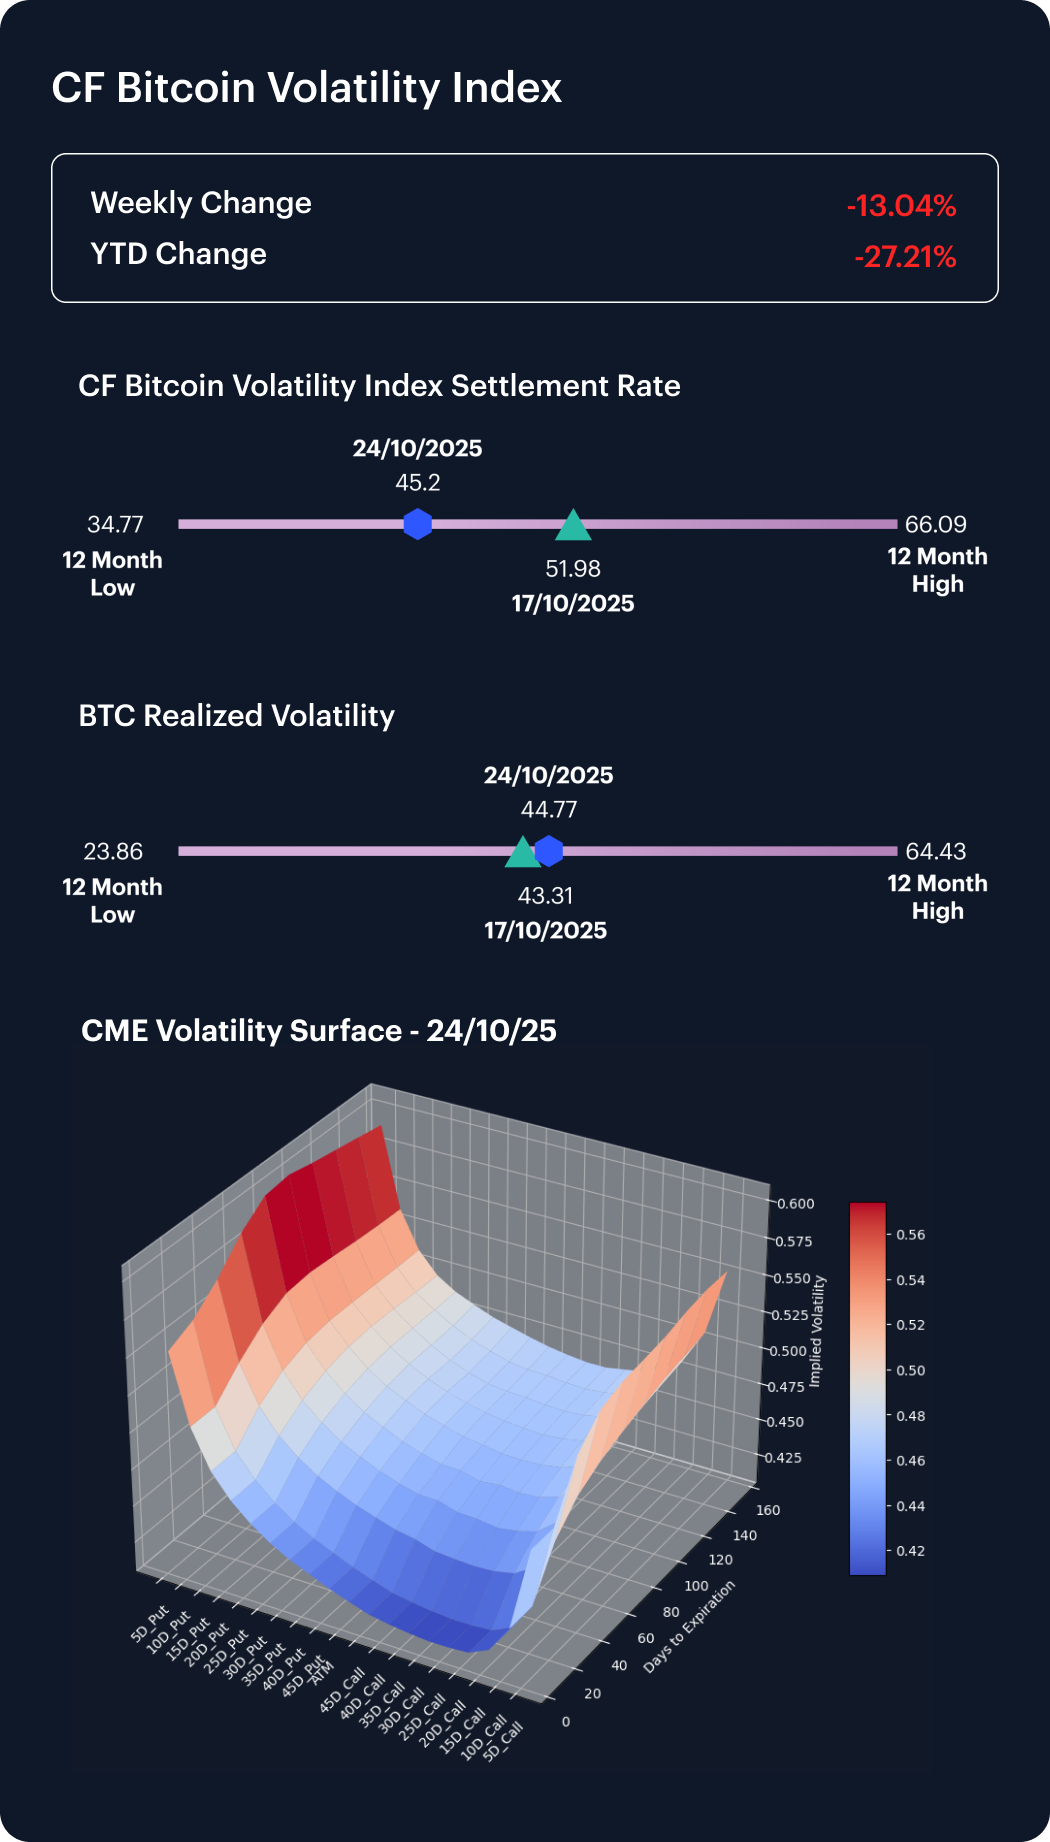
Volatility moderated further in the recently completed week. The CF Bitcoin Volatility Index (BVX) declined from its close on Friday October 17th, at 51.98 to 45.20 (−13.04%), while realized volatility edged up slightly to 44.77 from 43.31 (+1.46 pts). With implied falling faster than realized, the implied–realized gap narrowed, signaling reduced hedging demand, and a return to measured two-way trading. Current BVX levels remain above the 12-month low (34.77) but comfortably below the 12-month high (66.09), leaving the volatility surface firm yet orderly — a hallmark of range-bound consolidation.
Interest Rate Analysis
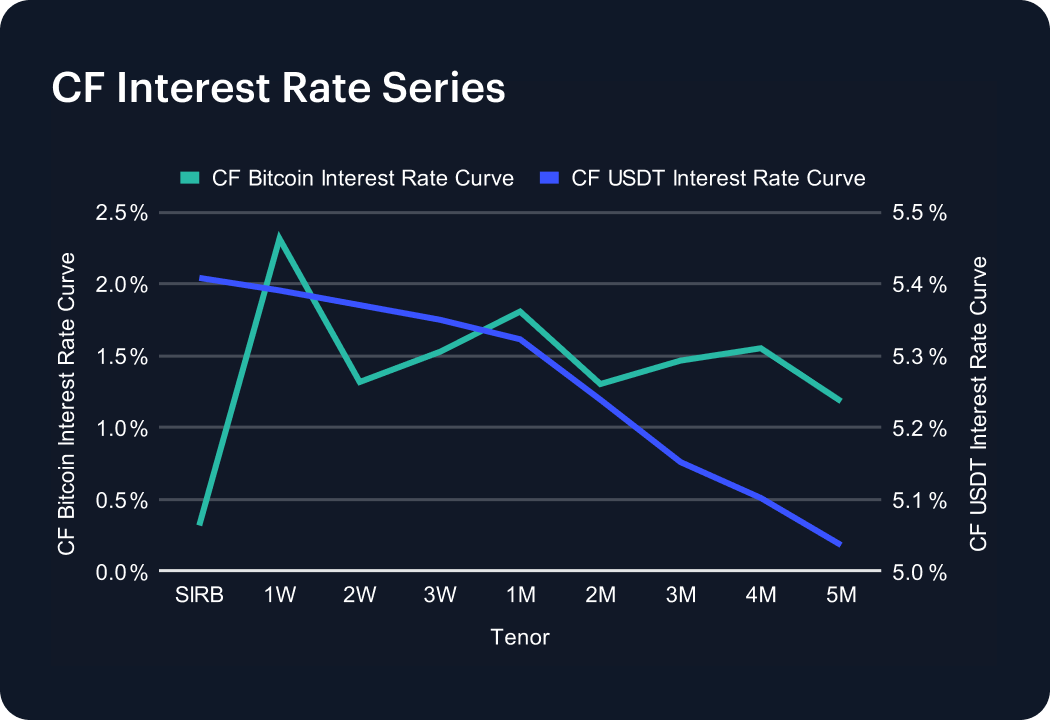
Crypto funding conditions eased week-on-week, looking at our proprietary Bitcoin and USDT curves. The CF Bitcoin Interest Rate Curve (BIRC) printed SIRB at 0.32%, 1W 2.32%, 2W 1.32%, 3W 1.53%, and 1M 1.81%, with tenors beyond 1-month steady between 1.18–1.55%. The CF USDT Interest Rate Curve remained elevated but slightly compressed: SIRB was at 5.41%, 1W at 5.39%, and 1M at 5.32%; tapering to 5.04% at 5M. The shape of both curves is flat-to-mildly downward-sloping, reflecting restrained leverage and steady front-end funding. BTC’s front remains anchored, while USDT carry shows continued softening, consistent with a calmer liquidity backdrop.
Factors Analysis
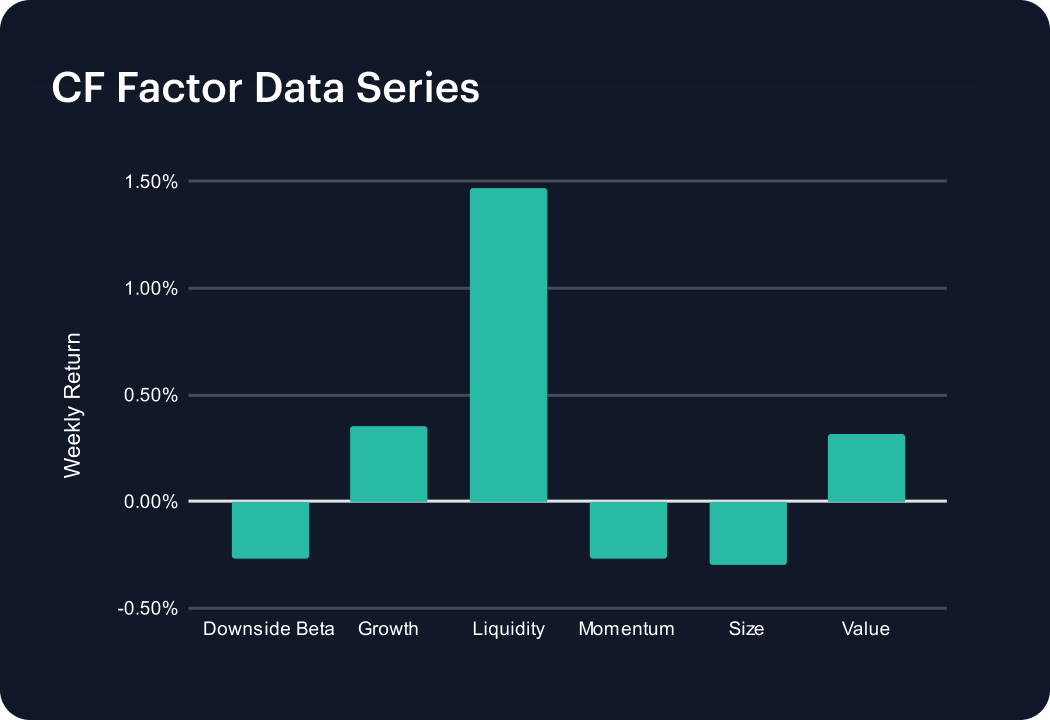
No specific 'style' stood out sharply in the most recent week, with CF Factor Intelligence data exhibiting mixed returns among our CF Benchmarks-validated Digital Asset Factors. Liquidity led with a +1.47% gain, followed by Growth +0.36%, and Value +0.32%. On the negative side, Downside Beta retreated −0.27%, Momentum, −0.27%, and Size, −0.30%. The composition indicates a rotation toward liquidity preference and quality factors, while risk-sensitive and cyclical exposures eased. Dispersion across styles narrowed versus the prior week, leaving factor breadth balanced into month-end.
The information contained within is for educational and informational purposes ONLY. It is not intended nor should it be considered an invitation or inducement to buy or sell any of the underlying instruments cited including but not limited to cryptoassets, financial instruments or any instruments that reference any index provided by CF Benchmarks Ltd. This communication is not intended to persuade or incite you to buy or sell security or securities noted within. Any commentary provided is the opinion of the author and should not be considered a personalised recommendation. Please contact your financial adviser or professional before making an investment decision.