
Weekly Index Highlights, November 10, 2025
Softer mega-caps brought a rotation in top-assets, while Services and Programmable led on data and scaling strength, and mid-caps outperformed, propelled by Web3, DeFi, and Culture. Staking was mixed with modest shifts. Implied BTC volatility firmed, while USDT rates stayed firm and Bitcoins' eased.


Market Performance Update
A more promising start of the current week thankfully, though unfortunately, the recently completed one was again marked by a further softening of top‑of‑book assets, resulting in another weak overall market outturn, albeit with a detectable rotation of leadership toward higher‑beta cohorts beneath the surface. Bitcoin (BTC) fell 2.92%, Ether (ETH) declined 3.43%, and Solana (SOL) slipped 5.01%. Despite softer headlines, breadth improved across mid‑caps and thematic baskets, consistent with a rotation into segments with greater operating leverage to on‑chain activity. Liquidity remained orderly and depth adequate, with pullbacks framed more as consolidation than as a shift in regime.
Sector Analysis
Through the CF Digital Asset Classification Structure (CF DACS) lens, performance was decisively higher, led by Services and the Programmable Sub-Category of Settlement. Other standout Sub-Categories included Utility, rising 21.03%, and Infrastructure gaining 16.03%, driven by Information & Data Management, SDK & Tooling and Scaling. Also worth noting: General Purpose Smart Contract Platforms advanced 14.84%. As for trend takeaways, Finance (+7.24%) and Culture (+6.53%) recovered broadly, while Payment & Store of Value lagged on a relative basis, +2.11%, amid mixed large‑cap moves. Overall, outperformers showed a bias to information‑rich and AI‑adjacent verticals, and the L2 complex also maintained momentum.
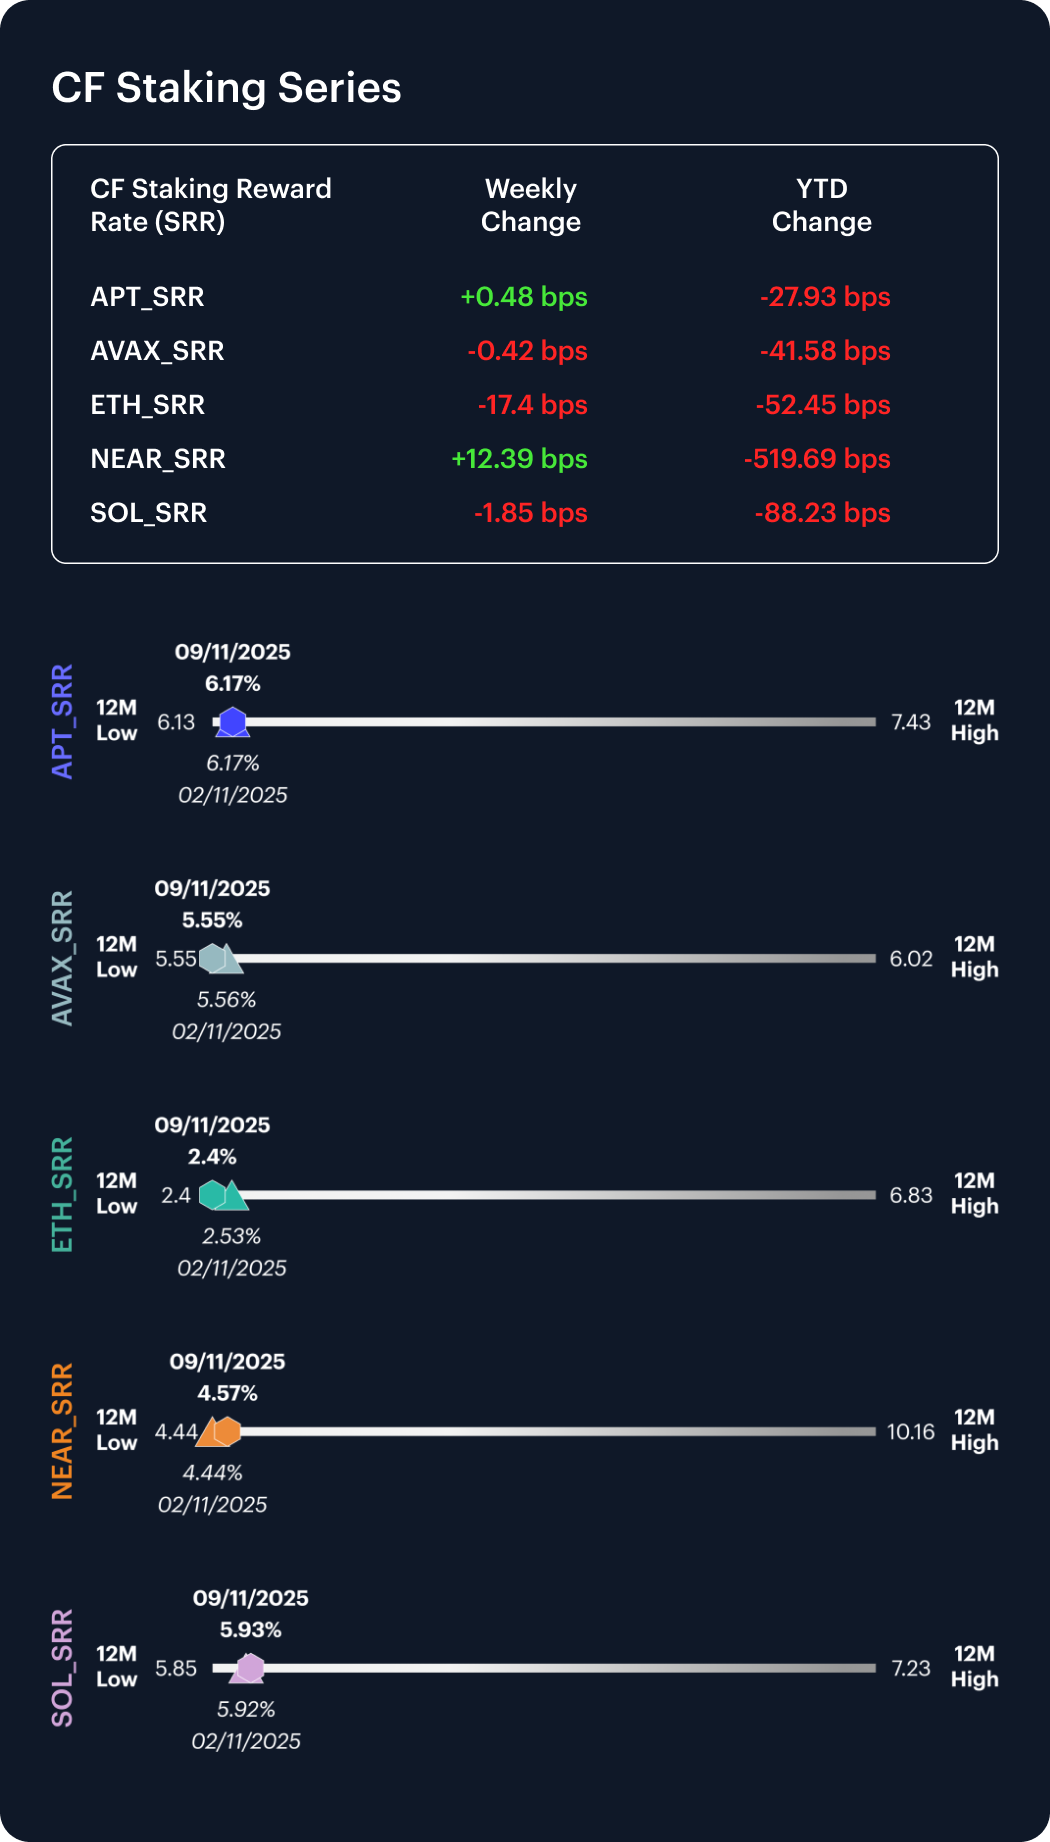
CF Staking Series
Within the CF Staking indices, performance diverged but carry moved only incrementally. Weekly staking returns printed APT +0.08%, AVAX -0.08%, ETH -6.76%, NEAR +2.79%, and SOL -0.31%. Reward-rate changes for the week were thereby correspondingly firm in the negative for ETH on a relative basis, -17.40 bps, minor for SOL, -1.85 bps, positive for NEAR +12.39 bps, slight for APT +0.48 bps, and slightly negative for AVAX -0.42 bps. Net-net, the carry profile remains broadly intact, with token-level beta and at least the impression of idiosyncratic catalysts driving most of the dispersion over the last week.
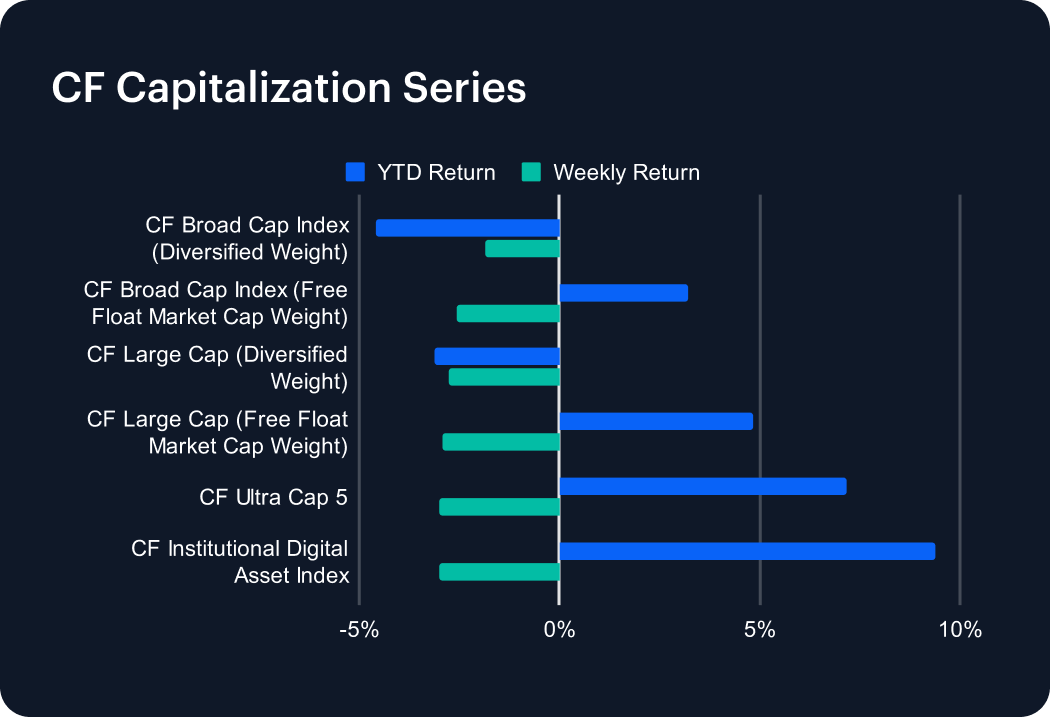
Market Cap Index Performance
By market-cap tiers, the CF Broad Cap Index (Diversified Weight) fell -1.84%, led by a decline in the CF Large Cap (Diversified Weight) at -2.78%, while the CF Ultra Cap 5 and the CF Institutional Digital Asset Index both declined by -3.00%. The pattern is consistent with rotation down the cap spectrum: mid-cap beta looks to have outperformed as investors sought convexity, even as top‑heavy indices reflected consolidation following recent strength.
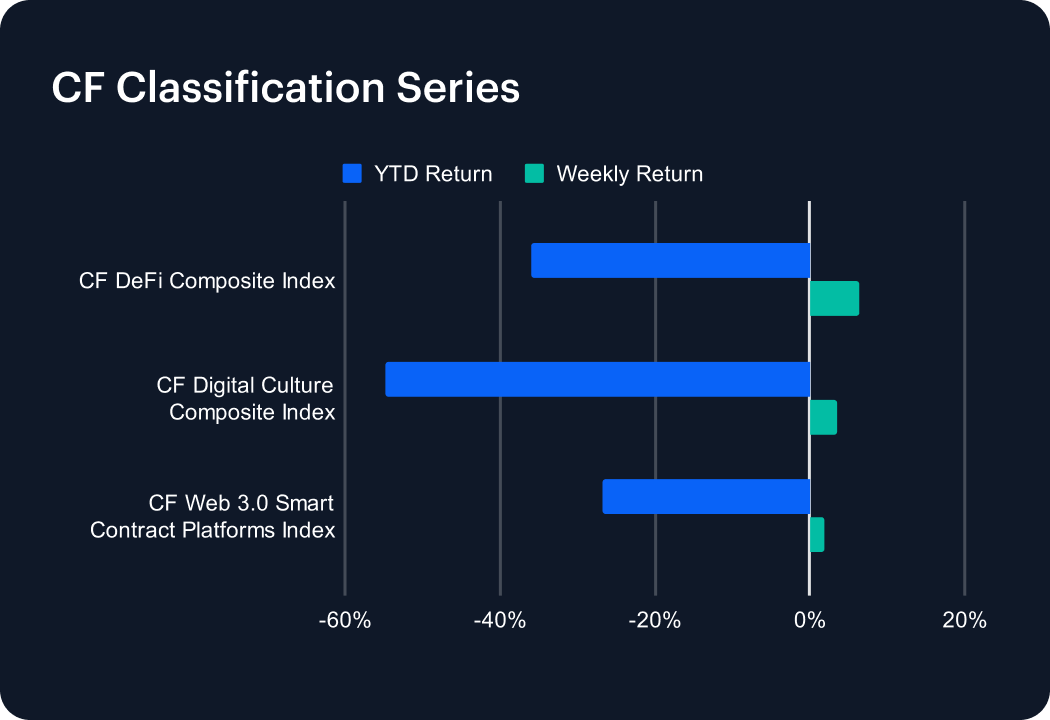
Classification Series Analysis
Across the CF Classification Series, the CF Web 3.0 Smart Contract Platforms Index gained 1.91%, the CF DeFi Composite Index rose 6.46%, and the CF Digital Culture Composite Index added 3.45%. Leadership skewed toward application-linked beta and fee-sensitive assets, with quality still rewarded but no longer singularly dominant. The balance of flows suggests investors continued to rotate toward segments with operational leverage to volumes, and on‑chain activity.
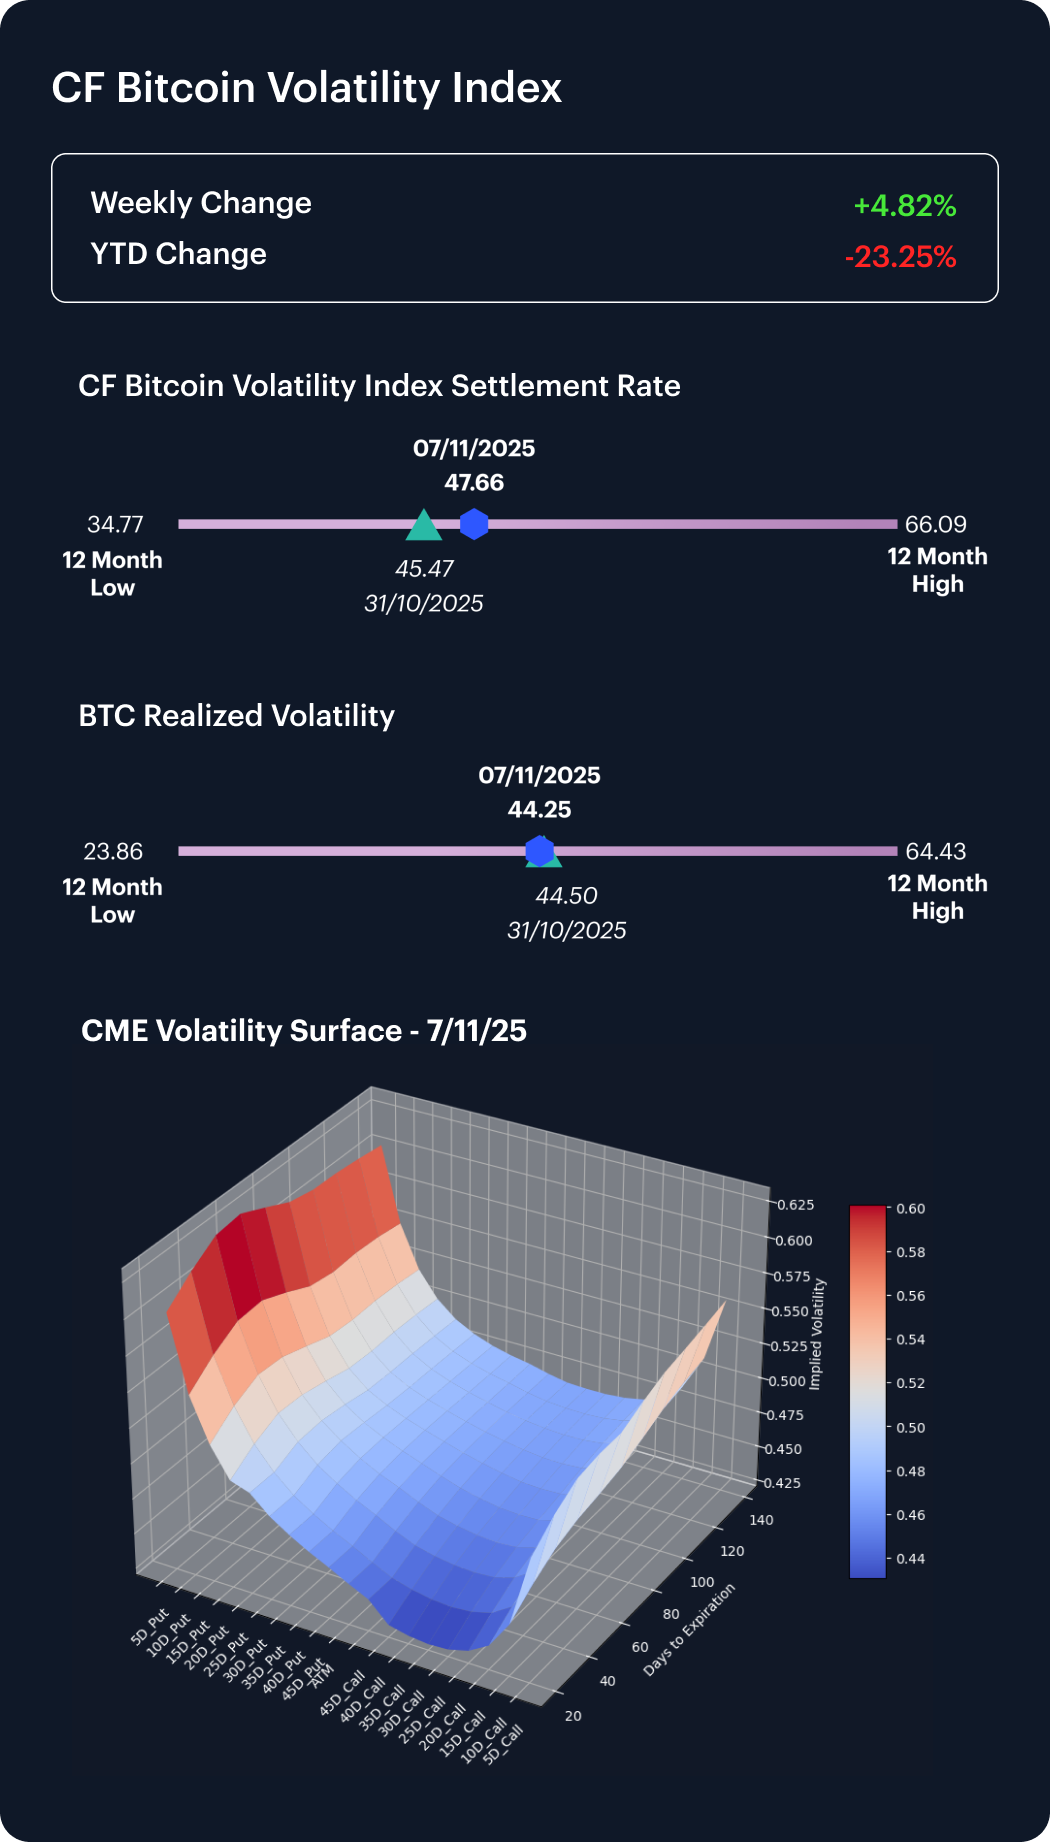
Volatility Analysis
Implied volatility re-firmed while realized was broadly unchanged. The Bitcoin Volatility Index (BVX) rose from 45.47 to 47.66 (+2.19 pts), whereas realized volatility edged from 44.50 to 44.25 (‑0.25 pts). The implied–realized spread widened, and the very front of the surface steepened modestly, consistent with demand for optionality into catalysts, even as spot maintained its recent fairly orderly trend.
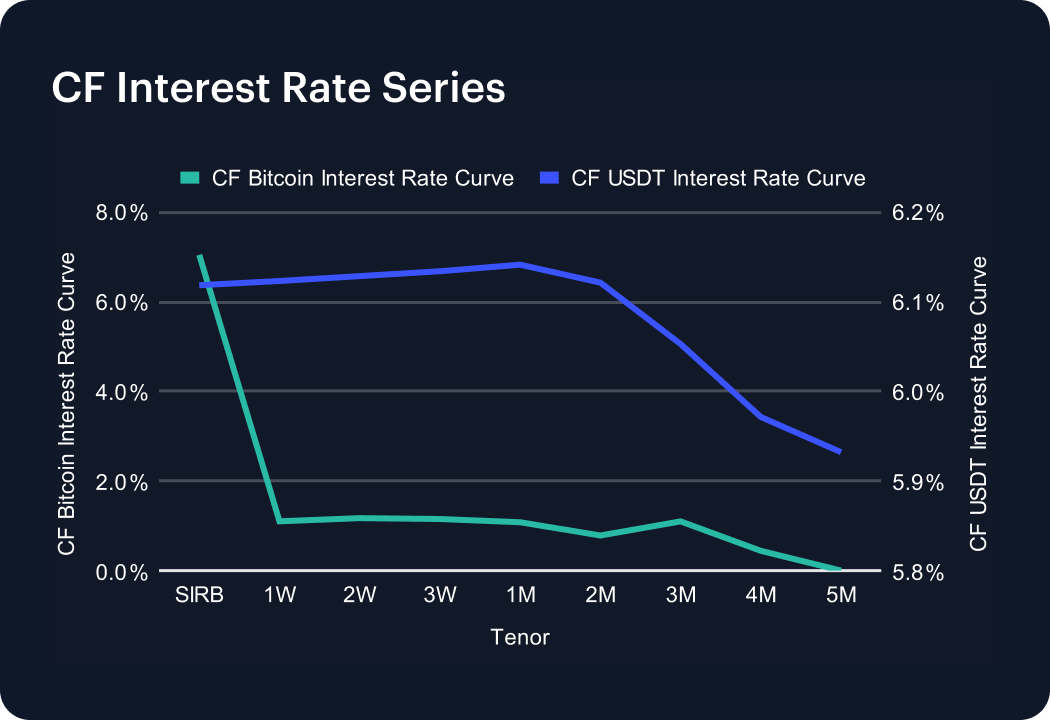
Interest Rate Analysis
Standout funding condition changes indicated greater compression at the front-to-belly for Bitcoin, while USDT’s profile hinted at upward flattening toward inversion. Bitcoin’s 1-week (1W) rate was 1.10% (-1.17 pp w/w) and USDT’s printed 6.12% (+1.50 pp); while for 2W: BTC saw 1.17% (+0.09 pp); and USDT 6.13% (+1.53pp); and for 1M: BTC hit 1.08% (-0.51 pp) while USDT printed 6.14% (+1.60 pp). At the 3M sector, BTC was 1.10% (-0.42 pp); against 6.05% for USDT (+1.68 pp); and the 5M rate brought no reading for BTC (0.00%) compared to USDT’s 5.93% (+1.64 pp). So, a broad flattening for BTC from 1W to 5M, while USDT’s curve was broadly stable through the 5M point.
The information contained within is for educational and informational purposes ONLY. It is not intended nor should it be considered an invitation or inducement to buy or sell any of the underlying instruments cited including but not limited to cryptoassets, financial instruments or any instruments that reference any index provided by CF Benchmarks Ltd. This communication is not intended to persuade or incite you to buy or sell security or securities noted within. Any commentary provided is the opinion of the author and should not be considered a personalised recommendation. Please contact your financial adviser or professional before making an investment decision.