
Weekly Index Highlights, March 31, 2025
Digital assets fell sharply, led by small-cap tokens, as the CF Broad Cap Index dropped 9.77%. Ether staking yields rose to 2.72%, Solana stayed at 6.90%. Bitcoin volatility ticked up to 49.72 despite lower realized volatility.


Market Performance Update
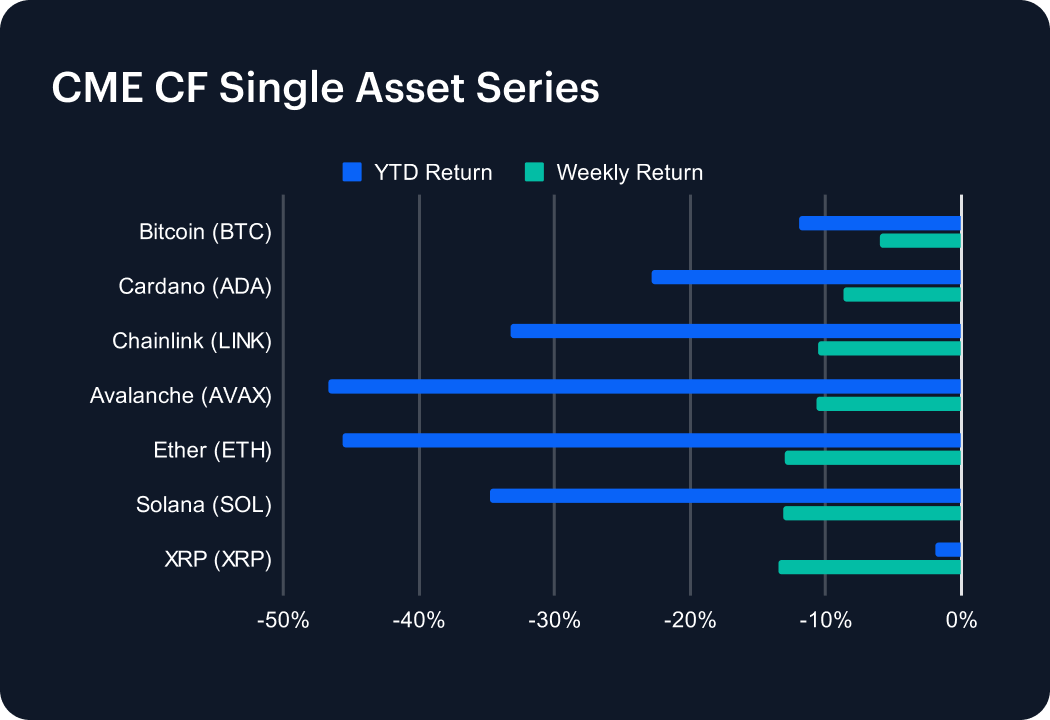
The digital asset market experienced renewed selling pressure this week, reversing previous gains as major cryptocurrencies declined significantly. XRP, previously a standout, suffered the steepest weekly loss, tumbling 13.45% and slipping into negative territory with a -1.99% year-to-date (YTD) return. Solana (SOL) and Ether (ETH) closely followed, dropping 13.09% and 13.05%, respectively, pushing their YTD losses to -34.78% and -45.67%. Avalanche (AVAX) also fell sharply, declining 10.73% to extend its YTD drop to -46.68%. Chainlink (LINK) and Cardano (ADA) lost 10.52% and 8.67%, respectively, deepening their YTD declines to -33.29% and -22.81%. Bitcoin (BTC) exhibited relative resilience, declining 6.06% weekly, but its YTD performance weakened further to -11.93%. Market sentiment remains fragile amid ongoing macroeconomic uncertainty.
Sector Analysis
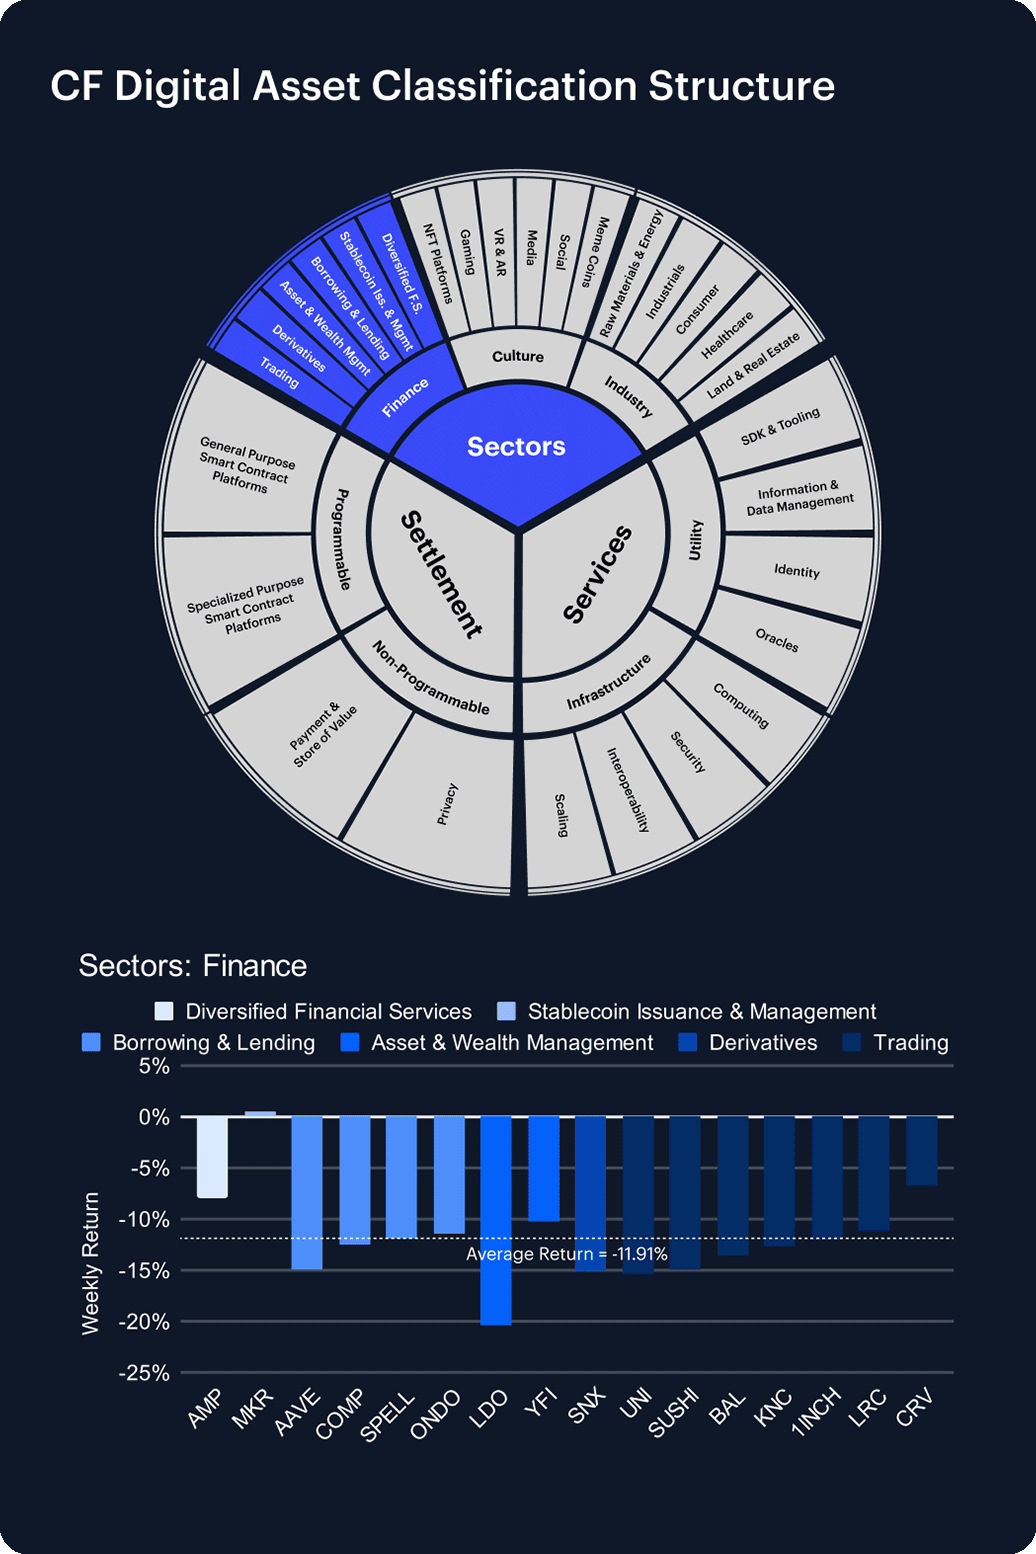
The CF DACS sub-categories faced broad declines this week, though select tokens managed to outperform. EOS stood out positively within the General Purpose Smart Contract segment, gaining 5.47% as the market’s top performer. MKR also bucked the downward trend in Stablecoin Issuance & Management, posting a modest 0.45% gain. Conversely, significant losses dominated the Meme Coin segment, with WIF plunging -22.92% and BONK down -22.02%. Among Asset & Wealth Management tokens, LDO was notably weak, declining -20.37%, while SKL (-20.69%) dragged down the Scaling category. Across segments, substantial declines in Gaming (AXS, -16.54%), VR and AR (LPT, -16.98%), and Specialized Smart Contract Platforms (INJ, -17.39%) underscored broad market weakness.
Staking Metrics
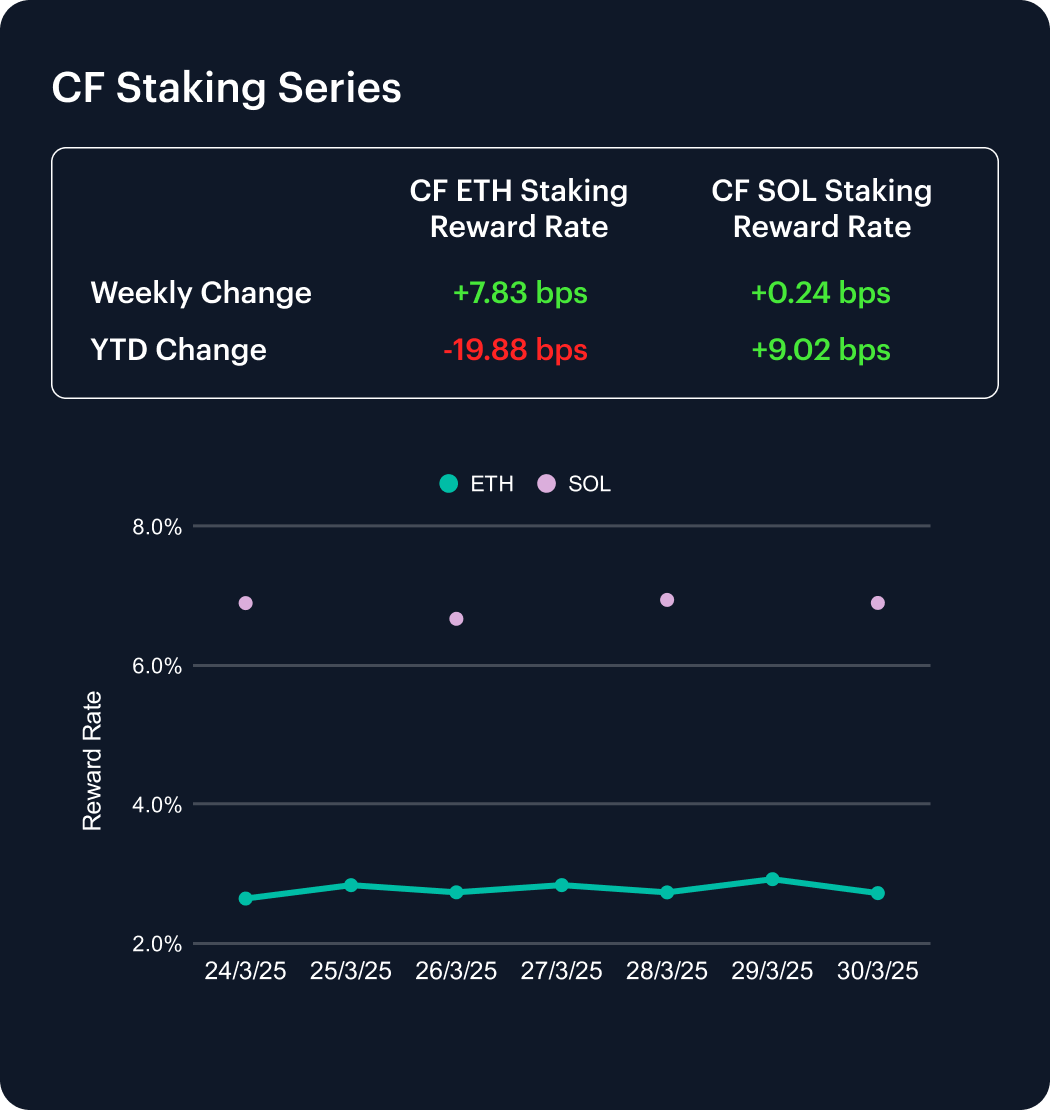
The CF Ether Staking Reward Rate Index (ETH_SRR) rose 7.83 basis points this week to reach 2.72%, reflecting a weekly gain of 2.96%. However, despite this improvement, ETH_SRR remains down 19.88 bps year-to-date, marking a cumulative YTD decline of 6.80%.
Meanwhile, the CF SOL Staking Reward Rate Index (SOL_SRR) was nearly unchanged, edging up only 0.24 bps to 6.90%, essentially flat with a 0.03% weekly increase. Yet, SOL_SRR maintains its positive trajectory for the year, rising by 9.02 bps YTD, equivalent to a 1.32% increase. These latest figures highlight a modest recovery in Ethereum staking yields after prolonged compression, while Solana continues to demonstrate relative stability and resilience in its staking performance throughout 2025.
Market Cap Index Performance
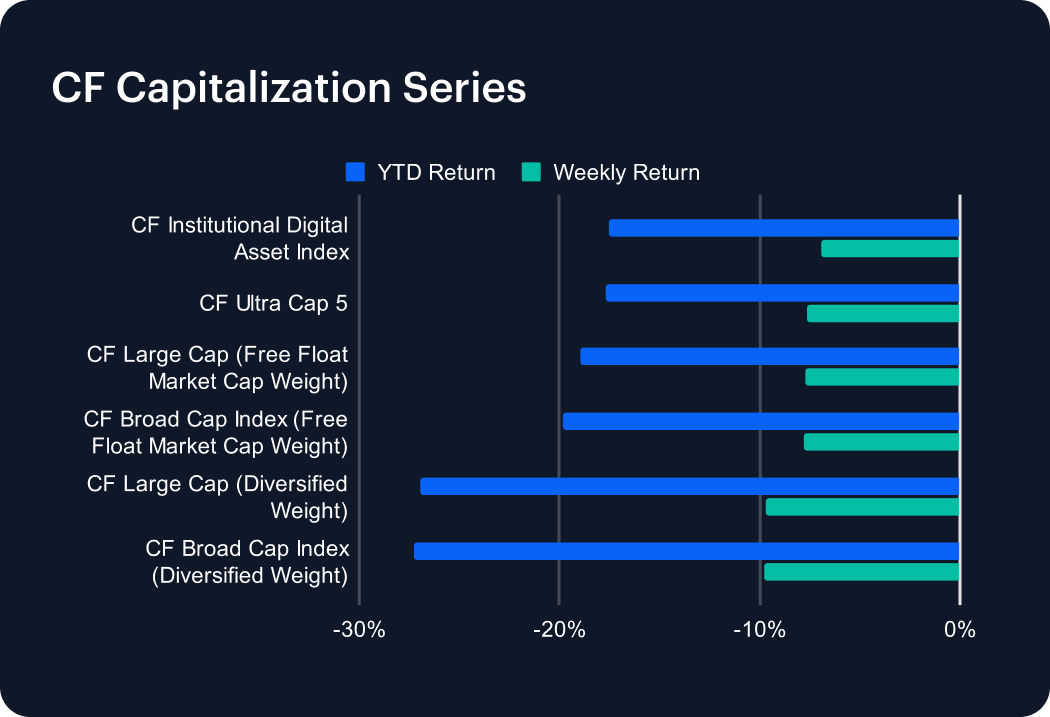
The CF Capitalization Series declined sharply this week, reversing recent gains as all major indices posted notable losses. Diversified-weighted indices underperformed significantly compared to their free-float market cap-weighted counterparts. The CF Broad Cap Index (Diversified Weight) was the weakest performer, declining 9.77% weekly and deepening its year-to-date (YTD) loss to -27.29%. Similarly, the CF Large Cap Index (Diversified Weight) dropped 9.70%, extending its YTD decline to -26.99%. Among free-float market cap-weighted indices, both the CF Broad Cap and CF Large Cap indices fell approximately 7.7%, pushing their YTD returns lower to -19.81% and -19.00%, respectively. The CF Ultra Cap 5 retreated 7.67%, and the CF Institutional Digital Asset Index lost 6.90%, further underscoring the ongoing flight to quality in 2025.
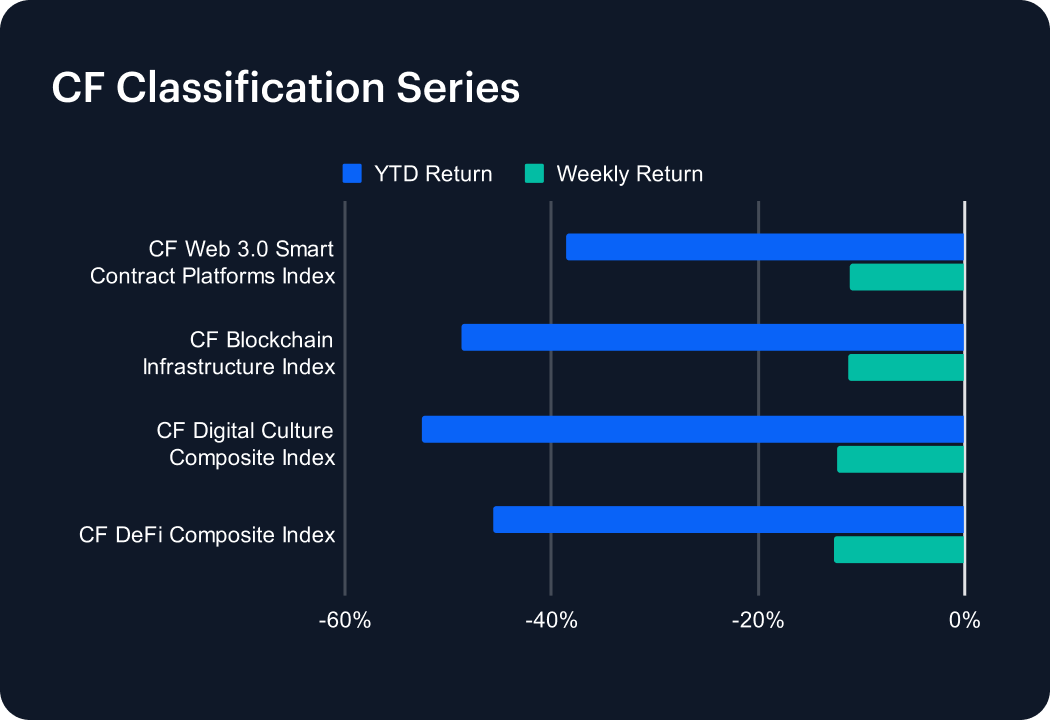
Classification Series Analysis
The CF Classification Series experienced steep declines this past week, erasing recent gains as the largest digital asset verticals faced renewed selling pressure. The CF DeFi Composite Index was the weakest performer, plunging -12.60% weekly and extending its year-to-date (YTD) loss to -45.69%. The CF Digital Culture Composite Index closely followed, dropping -12.38%, which deepened its already significant YTD decline to -52.61%. The CF Blockchain Infrastructure Index fell -11.21%, pushing its YTD return further into negative territory at -48.65%. Similarly, the CF Web 3.0 Smart Contract Platforms Index retreated by -11.16%, worsening its YTD performance to -38.60%. These sharp weekly losses highlighting investor caution in small-cap digital assets as the broad market shows continued weakness.
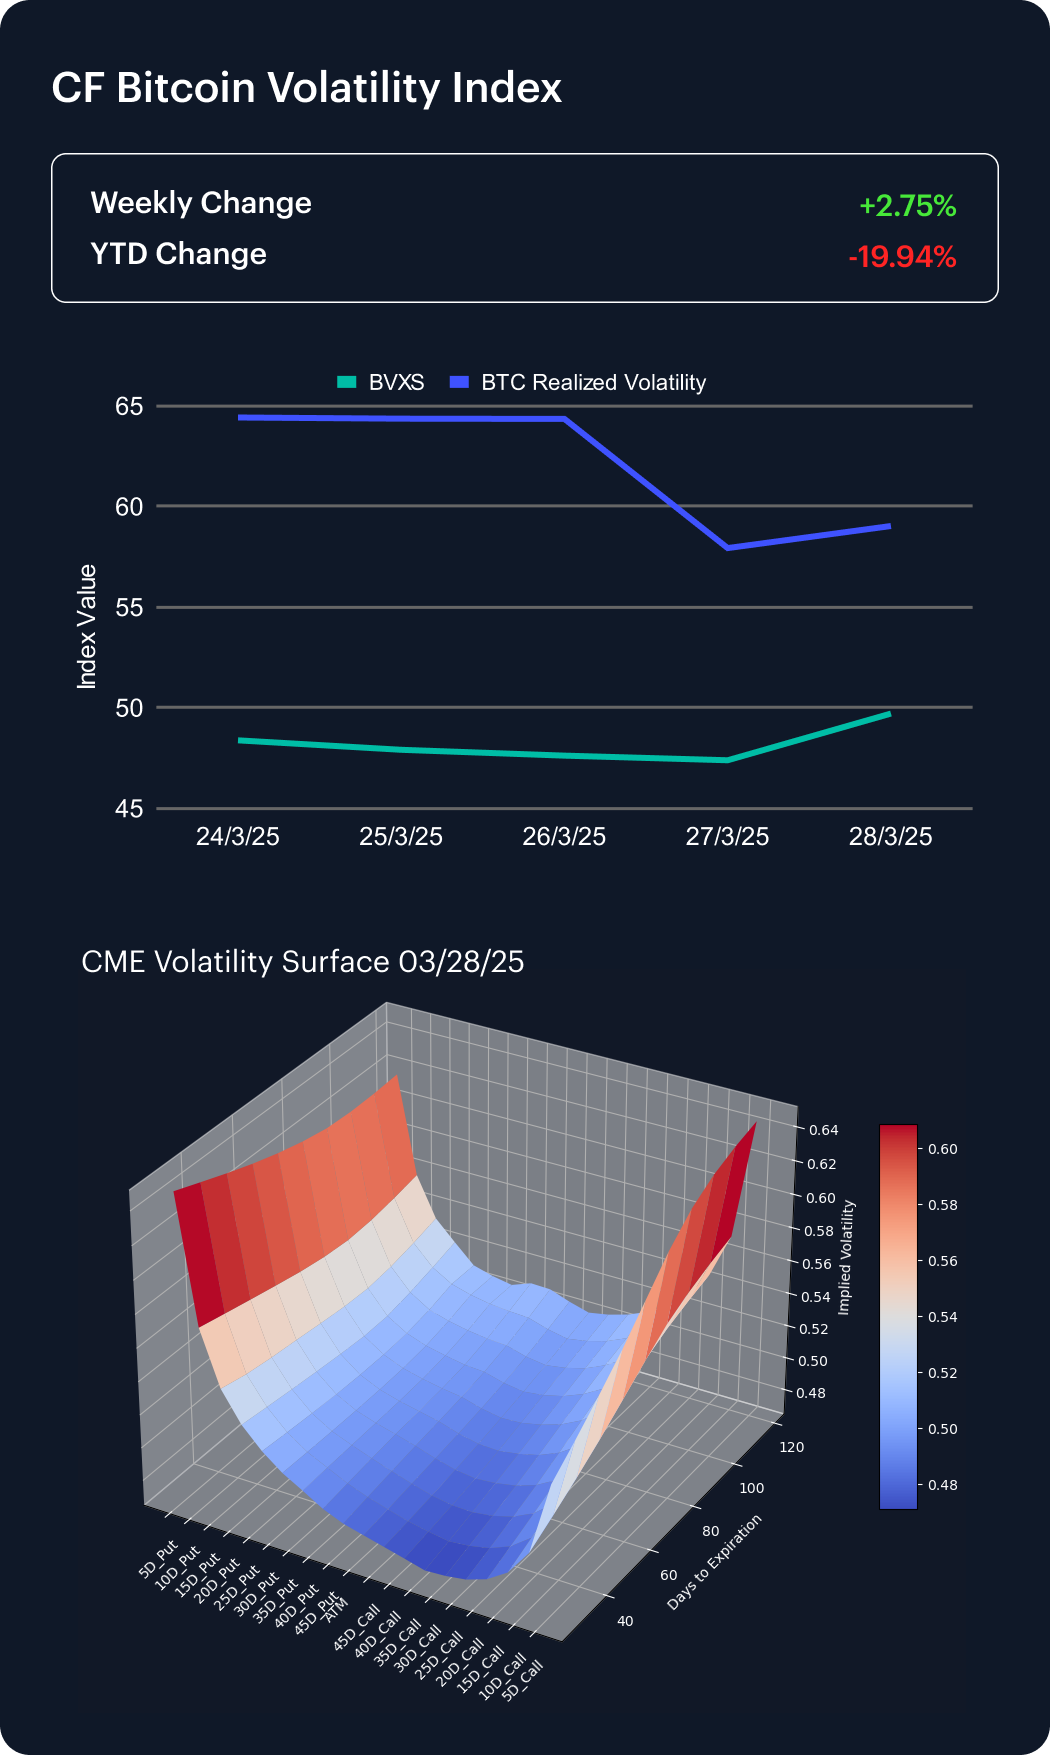
Volatility Analysis
The CF Bitcoin Volatility Index Settlement Rate (BVXS) rose modestly this past week, increasing 2.75% to close at 49.72, though it remains down -19.94% year-to-date (YTD). Conversely, realized volatility decreased significantly, starting the week at 64.43 and declining to 59.04. This indicates easing short-term market movements despite a modest rise in implied volatility.
CME Bitcoin Volatility Surface analysis reveals a notable shift in sentiment, as skews at the 10-, 15-, 20-, and 25-delta levels all turned negative. This broadening negative skew highlights increasing investor demand for downside protection across strikes, reflecting heightened caution regarding potential price declines. Elevated convexity persists, underscoring the continued market awareness of possible sharp directional moves amid prevailing uncertainty.
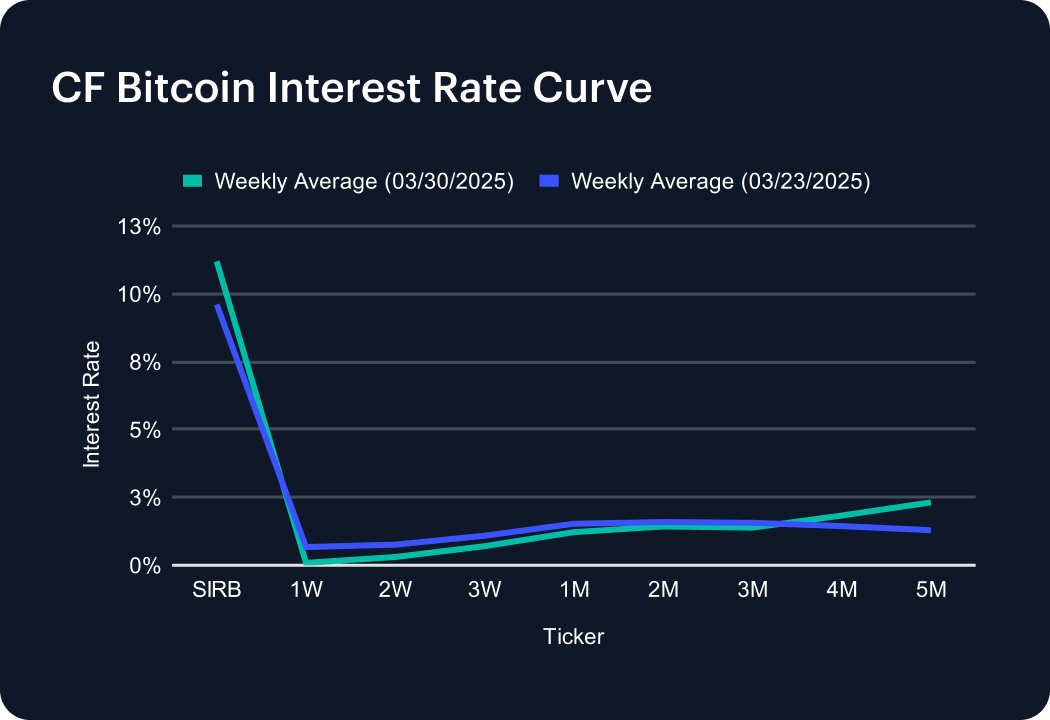
Interest Rate Analysis
The CF Bitcoin Interest Rate Curve shifted notably over the past week, with short-term borrowing costs rising sharply. The Short-Term Interest Rate Benchmark (SIRB) climbed significantly to 11.20% from 9.61%, signaling elevated demand for immediate liquidity. However, shorter-dated tenors softened, as the 1-week rate dropped to 0.09%, the 2-week fell to 0.30%, and the 3-week declined to 0.70%. Medium- to longer-term rates reversed higher, reflecting renewed market interest; the 4-month rate rose to 1.83%, and the 5-month jumped markedly to 2.31%. These shifts indicate investors’ increasing preference for longer-term borrowing, even amid elevated short-term volatility.
The information contained within is for educational and informational purposes ONLY. It is not intended nor should it be considered an invitation or inducement to buy or sell any of the underlying instruments cited including but not limited to cryptoassets, financial instruments or any instruments that reference any index provided by CF Benchmarks Ltd. This communication is not intended to persuade or incite you to buy or sell security or securities noted within. Any commentary provided is the opinion of the author and should not be considered a personalised recommendation. Please contact your financial adviser or professional before making an investment decision.