
Weekly Index Highlights, March 17, 2025
Digital assets experienced moderate relief this week, though sharp underperformance in some areas and lackluster gains among large caps suggest that the crypto market's recent volatility may not be entirely over just yet.


Market Performance Update
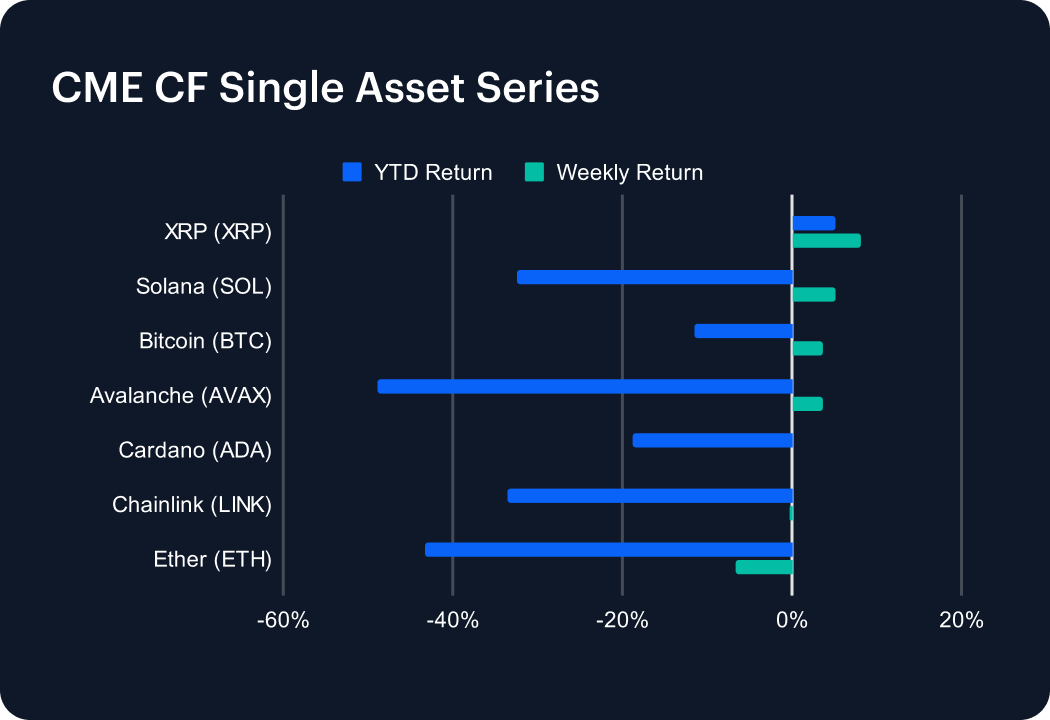
Although the most recent week was not entirely bereft of volatility, large cap digital assets managed to avoid a further consecutive week of sharp declines with select assets reasserting recent resilience, and new constructive narratives emerging for others. XRP bounced +8.14%, keeping its status as the only asset in this series with a positive year-to-date (YTD) return (+5.16%). Solana added +5.2%, offsetting its chunky YTD decline, which now stands at -32.42%. Bitcoin also saw relief, with a +3.67% rise, while Avalanche (AVAX) closely matched that by eking out a 3.66% gain, as news emerged of one of the first filings for a U.S.-listed AVAX ETFs. AVAX remains the deepest underperformer YTD, having lost -48.90%. Among protocols in the CME CF Single Asset Series which failed to catch a break, or only a desultory one: Cardano ticked +0.18% higher, Chainlink marginally reversed, -0.24%, while Ether (ETH) dropped 6.55%. That means ETH was notably the biggest weekly under performer and also the second-worst performer on a YTD basis, -43.25%
Classification Performance
Key CF DACS segments posted gains, albeit only marginal ones, on a combination of lackluster performances by large cap protocols combined with pockets of more substantive positive Sub-Category performances. Starknet (STRK) and Celestia (TIA) supported the Infrastructure Sub-Category of the Services Applications, gaining +14.70% and +11.80% respectively, leaving the Sub-Category up +6.53%, the best weekly performance in that demarcation. In the Culture Sub-Category, Echelon Prime (PRIME) also shone, +15.12%, trailed by Gaming Segment peers, Immutable (IMX), +3.37%, Superverse (SUPER), +2.96% and others; bringing the average weekly return for the Culture Sub-Category to +2.09%. Other pockets of outperformance included Cosmos (ATOM), +18.19%, in the General Purpose Smart Contract Platforms Segment, and Curve DAO Token (CRV), in DeFi’s Trading Segment, +10.08%.
Staking Metrics
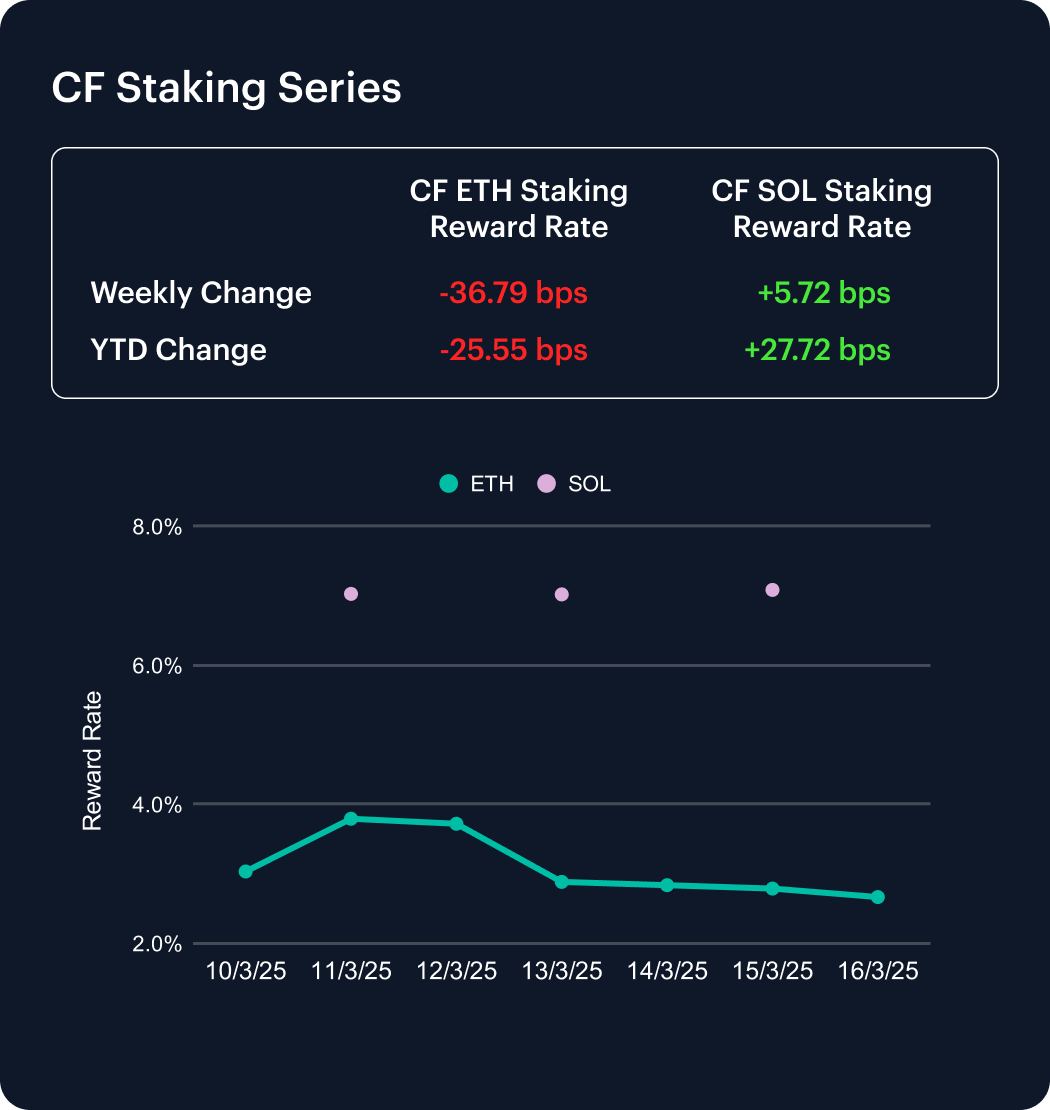
The CF Ether Staking Reward Rate Index (ETH_SRR) continued its marked decline, losing -36.79 basis points, for a weekly change of -12.12%, maintaining its poor start to the year, leaving the YTD return at -8.74%.
The CF Solana Staking Reward Rate Index (SOL_SRR) switched from relative to outright outperformance of its Ether counterpart over the week, with a +0.81% return, or +5.72 basis points. SOL_SRR’s YTD gain of +27.72 basis points is currently almost the mirror image of ETH_SRR’s YTD decline of -25.55 basis points.
Market Cap Index Performance
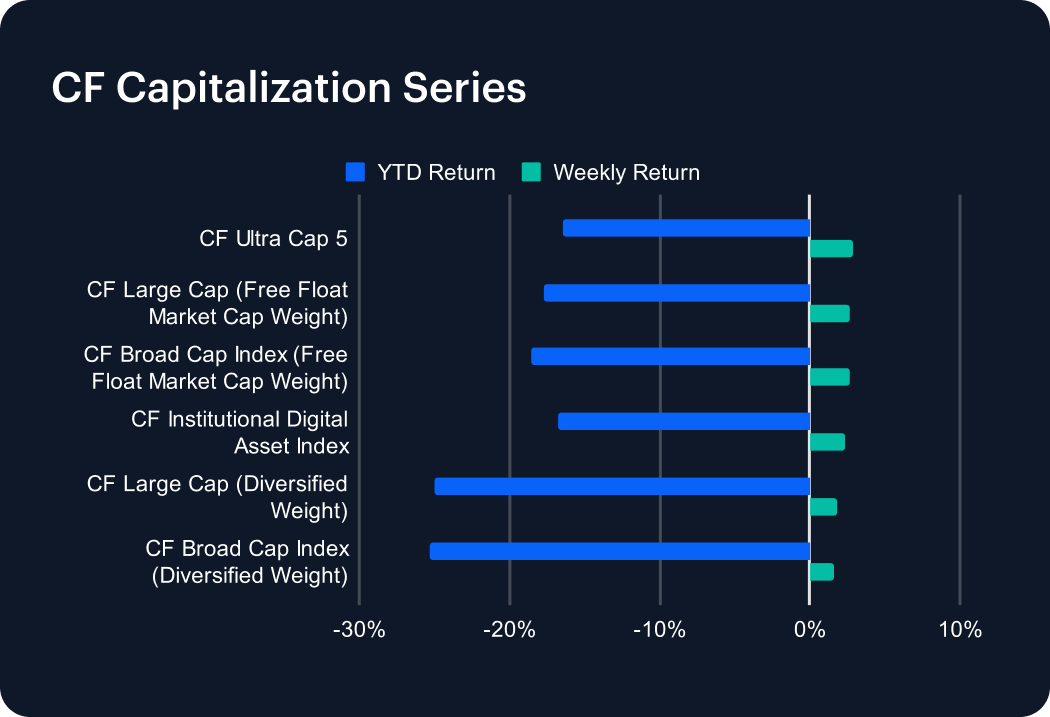
All Capitalization Series indices reflected the mild relief trend across markets last week, though the CF Ultra Cap 5’s +2.84% as the strongest outperformance provides a useful characterization of the digital asset market’s overarching performance. CF Broad Cap Index (Diversified Weight) relatively underperformed, rising a meagre +1.6%. Together with the +2.67% rise of CF Large Cap (Free Float Market Cap Weight), it was a week largely favouring the more heavily weighted constituents in market cap terms.
Classification Series Analysis
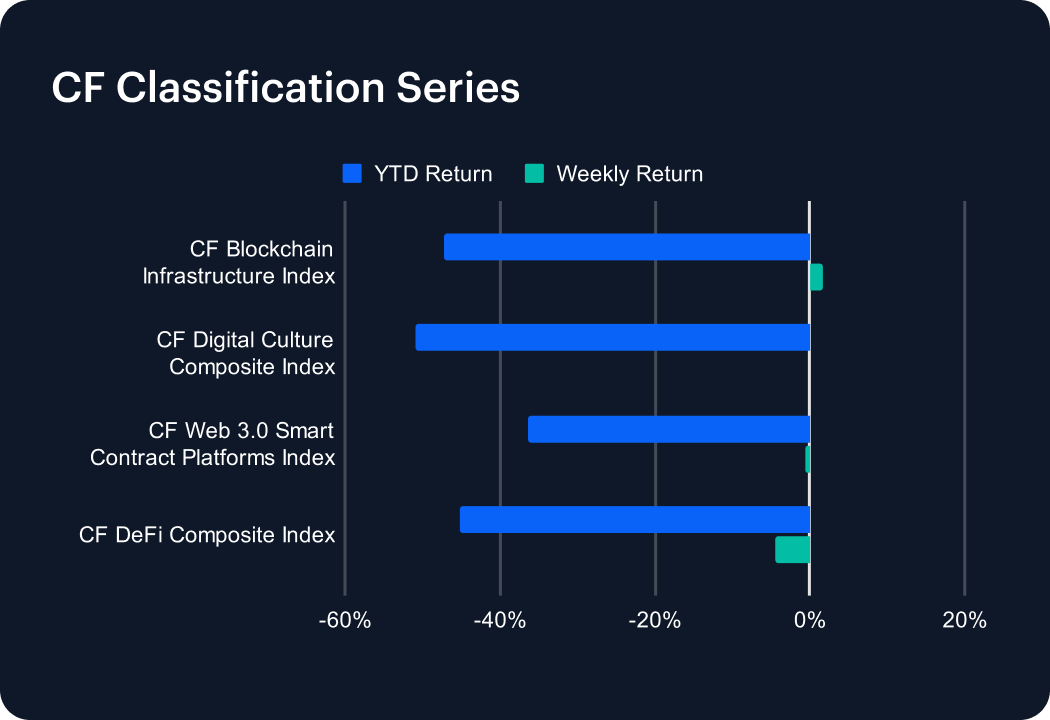
Seen through the lens of the CF Classification Series, it appeared to be an even less inspiring week, with the CF Blockchain Infrastructure Index’s +1.70% return being the most positive one, and the CF Digital Culture Composite Index inching ahead by a tiny 0.05%. The worst Classification Series weekly performance came from the CF DeFi Composite Index, -4.45%. YTD returns are already looking formidably negative across the board. The CF Digital Culture Composite Index is down -50.85%, with the CF Blockchain Infrastructure Index not far behind, -47.29%. The relative YTD outperformer is CF Web 3.0 Smart Contract Platforms Index, -36.46%.
Volatility
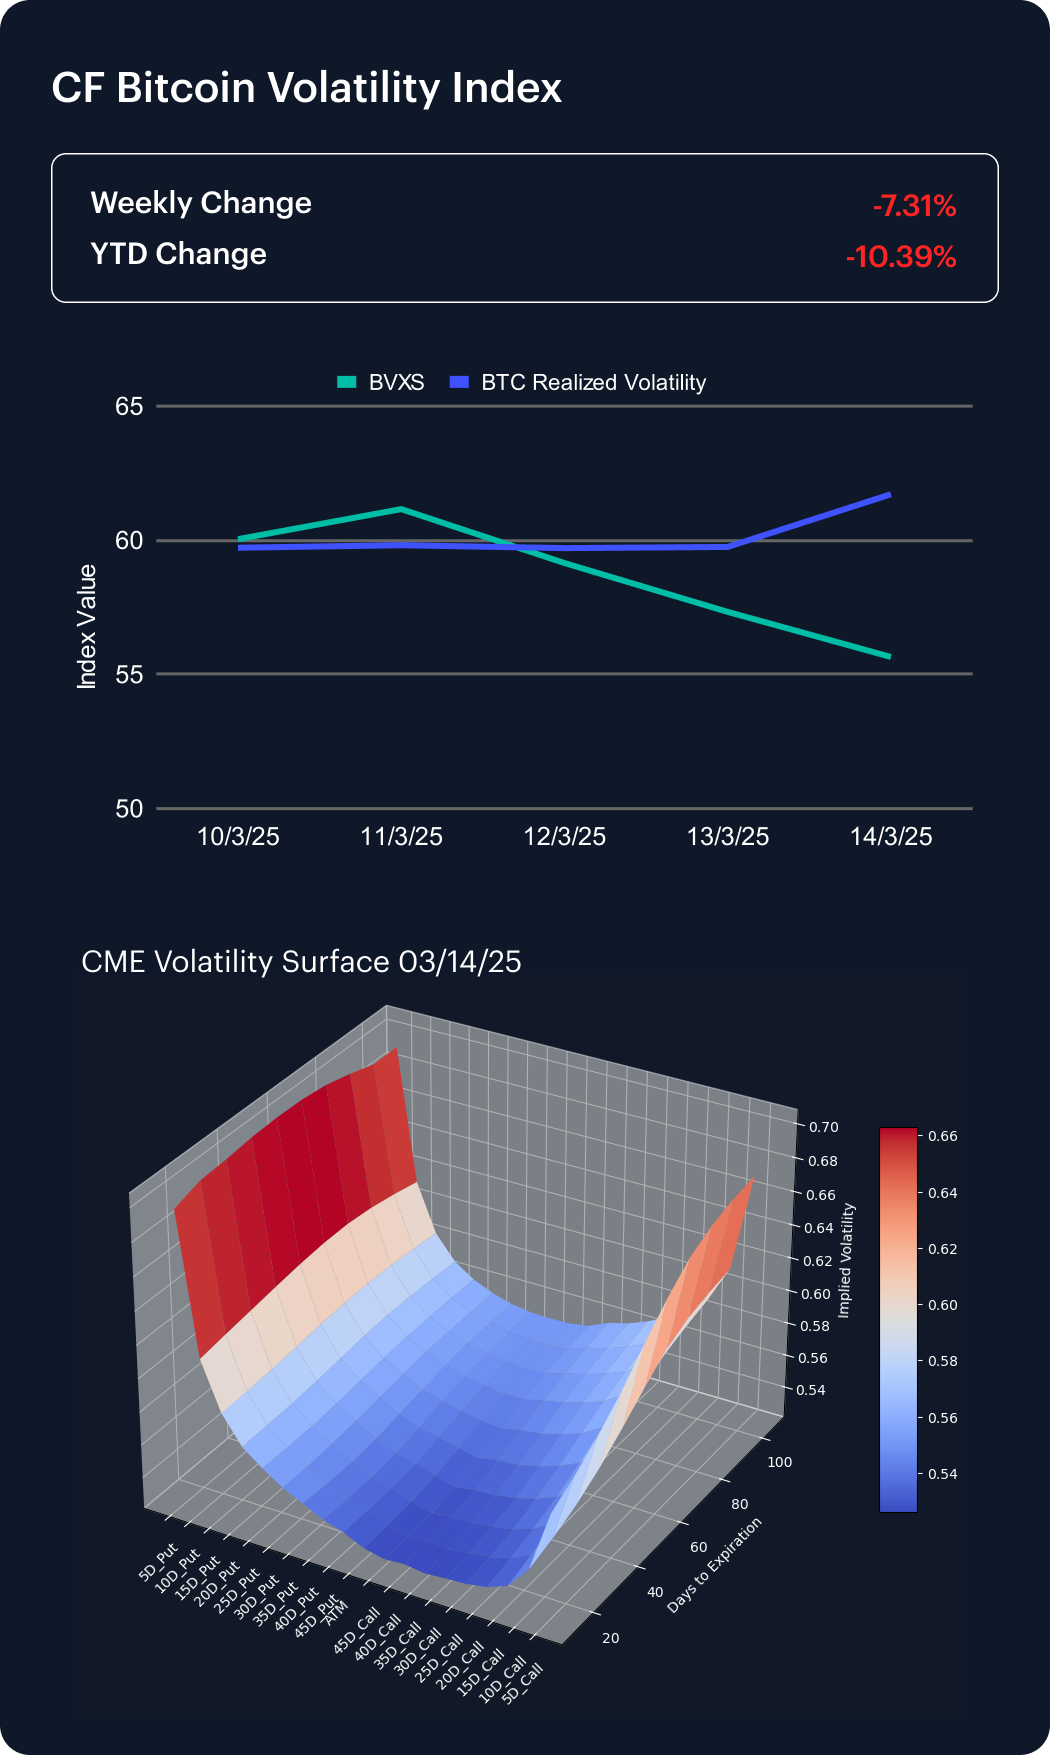
The CF Bitcoin Volatility Index Settlement Rate (BVXS) reflected perceived respite in terms of the extent of Bitcoin implied volatility, though it’s worth noting realized BTC volatility rose over the week. The BVXS weekly change was -7.31%, extending its YTD retreat to -10.39%.
The CME Bitcoin Volatility Surface displays continued elevated convexity, though qualified by a decline of implied volatility for shorter-dated options. The skew remains negative across the board, highlighting continued preference for downside protection. All told, together with a slight uplift in the skew for longer-dated contracts, the CME Bitcoin Volatility Surface and Skew hint that participants are expecting a more measured view of sentiment to emerge in the relatively short term.
Interest Rate Analysis
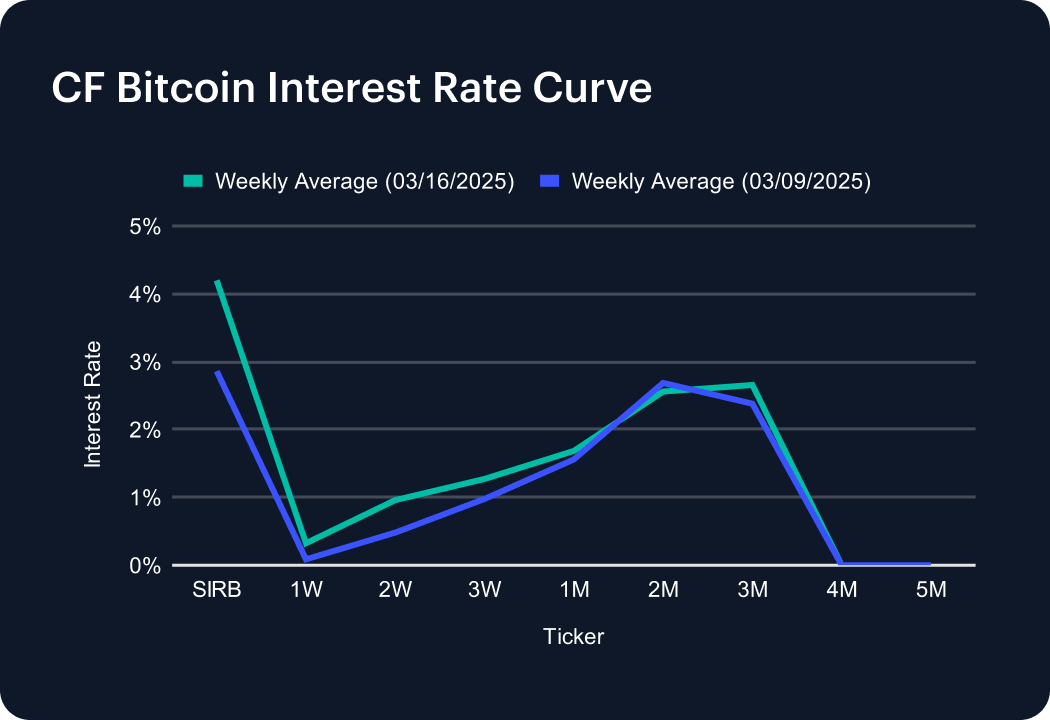
The CF Bitcoin Interest Rate Curve generally maintained the trend of recent weeks, with a moderate outperformance on the shorter end. In fact, the session rate ending at 4.20% compared to 2.86% the week before was the biggest change to the upside. The Weekly tenor crept out to 0.32% from 0.09%; 2-Week posted 0.96% versus 0.48%; and 3-Week ended at 1.27, compared to 0.98%. 4-Month and 5-Month rates again provided readings of zero. Overall, despite a rise in demand for shorter-dated borrowing, this was more of a wait-and-see week for Bitcoin credit markets.
The information contained within is for educational and informational purposes ONLY. It is not intended nor should it be considered an invitation or inducement to buy or sell any of the underlying instruments cited including but not limited to cryptoassets, financial instruments or any instruments that reference any index provided by CF Benchmarks Ltd. This communication is not intended to persuade or incite you to buy or sell security or securities noted within. Any commentary provided is the opinion of the author and should not be considered a personalised recommendation. Please contact your financial adviser or professional before making an investment decision.