
Weekly Index Highlights, July 14, 2025
Crypto's winning streak has extended, with diversified-weight Broad Cap and Large Cap benchmarks up nearly 15%; outpacing ~12% gains by free-float counterparts. ADA and XRP both rose over 20%. Staking yields ticked up, led by SOL's +1%. BTC's realized volatility spiked despite muted implied vol.

Market Performance Update
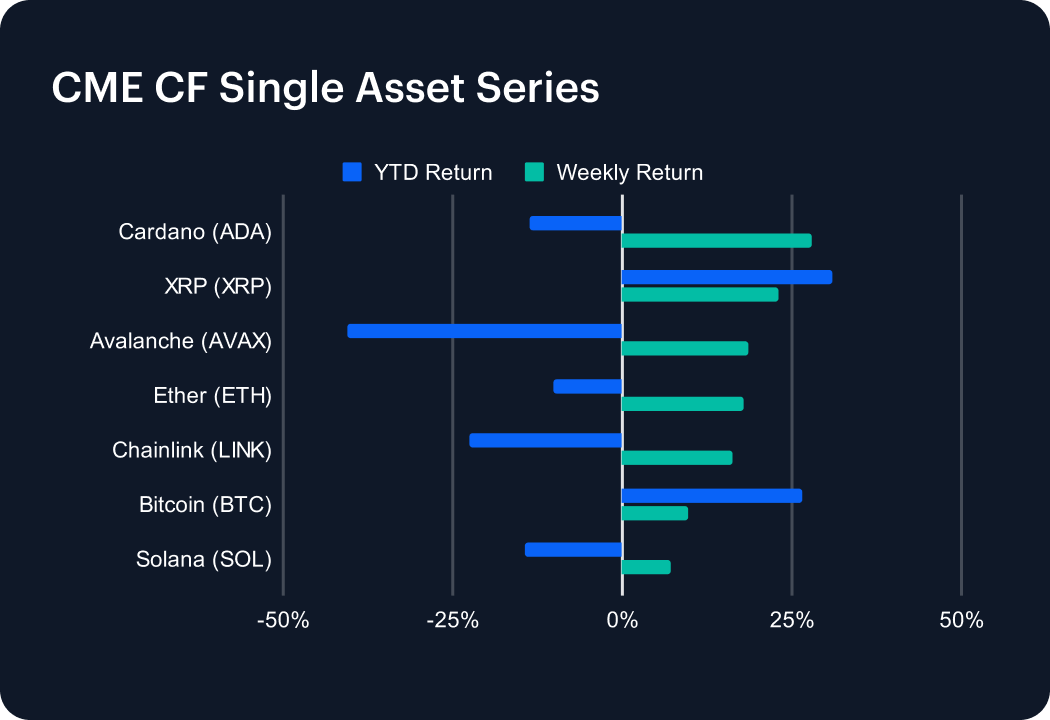
The digital-asset market extended its rally last week, with all seven major tokens closing in positive territory. Leading the charge was Cardano (ADA), which soared 27.89% and trimmed its year-to-date decline to 13.67%. Ripple’s XRP (XRP) followed with a 22.99% gain, widening its YTD advance to 30.88%. Avalanche (AVAX) climbed 18.55%, easing its slide to 40.61% year-to-date, while Ether (ETH) rose 17.78%, reducing its YTD loss to 10.17%. Chainlink (LINK) added 16.13%, pulling back its YTD decline to 22.50%, and Bitcoin (BTC) gained 9.79%, reaching a new all-time high and lifting its annual return to 26.48%. Solana (SOL) inched up 7.15%, narrowing its YTD loss to 14.31%. Continued regulatory progress and corporate treasury announcements bolstered investor risk apatite.
Sector Analysis
The DACS market saw another broad-based advance last week, though leadership skewed heavily toward settlement and trading tokens. At the top, XLM surged 81.90%, while Trading heavyweights KNC and 1INCH leapt 79.02% and 75.66%, respectively. Among programmable settlement tokens, HBAR and ALGO climbed 53.24% and 44.72%. Within infrastructure, HNT vaulted 38.01%, while scaling peers ARB and POL up 25.75% and 25.67%. Meme-coins also chipped in, PEPE rose 25.71%, but some segments lagged. The softest gains came from BCH (2.76%) in Store of Value and Payment, RARI (5.38%) in Meme Coins, and SOL (7.15%) among smart-contract platforms. Overall, Non-Programmable tokens drove the rally, while smaller niches such as VR tokens and interoperability plays saw more modest lifts.
Staking Metrics
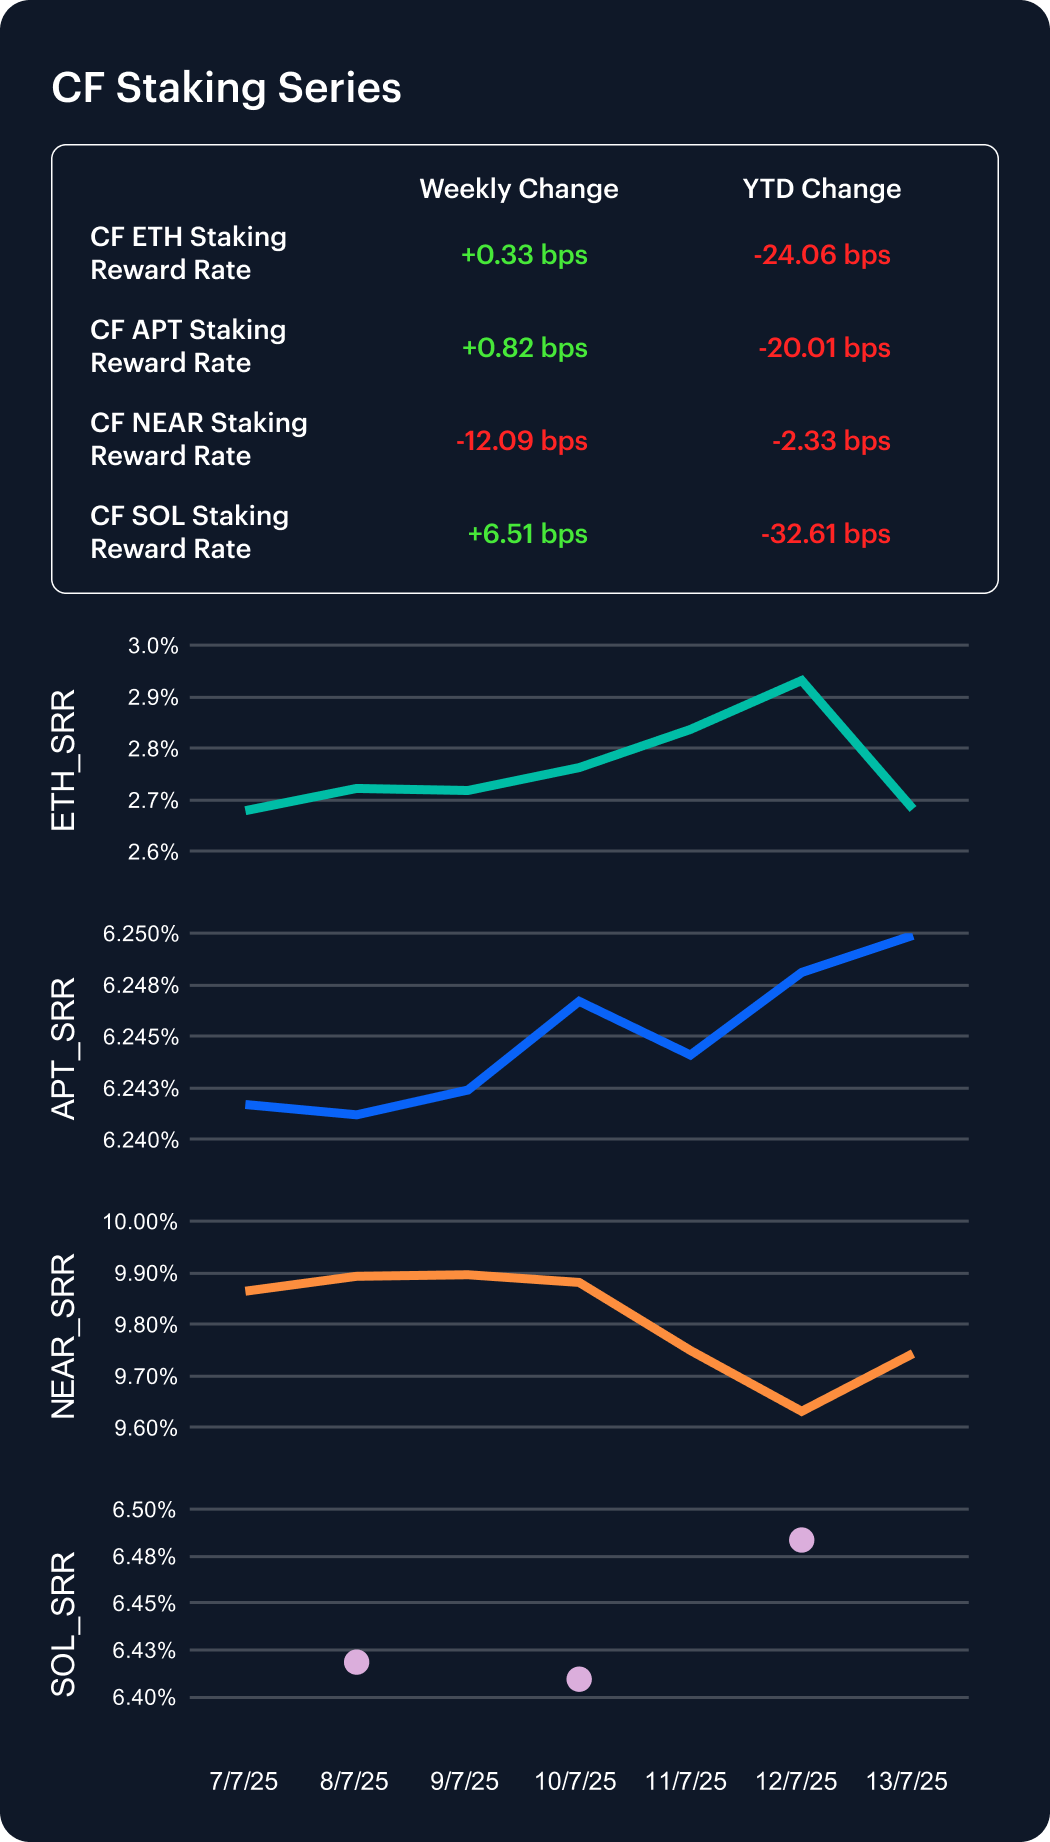
Staking yields diverged last week, with Solana leading the pack. SOL saw a 1.01% weekly increase as its SOL_SRR added 6.51 bps to 6.48%, narrowing its YTD decrease to 4.79%. Aptos ticked up 0.13%, with APT_SRR gaining 0.82 bps to 6.25%, 20 bps lower on the year. Ether inched 0.12% higher, with ETH_SRR +0.33 bps to 2.68%, trimming its YTD decline to 8.23%. NEAR was the laggard: its NEAR_SRR slid 12.09 bps to 9.74%, reversing its YTD gain into a 0.24% decline. Divergent on-chain activity and inflation dynamics continue to widen staking reward dispersion across PoS networks.
Market Cap Index Performance
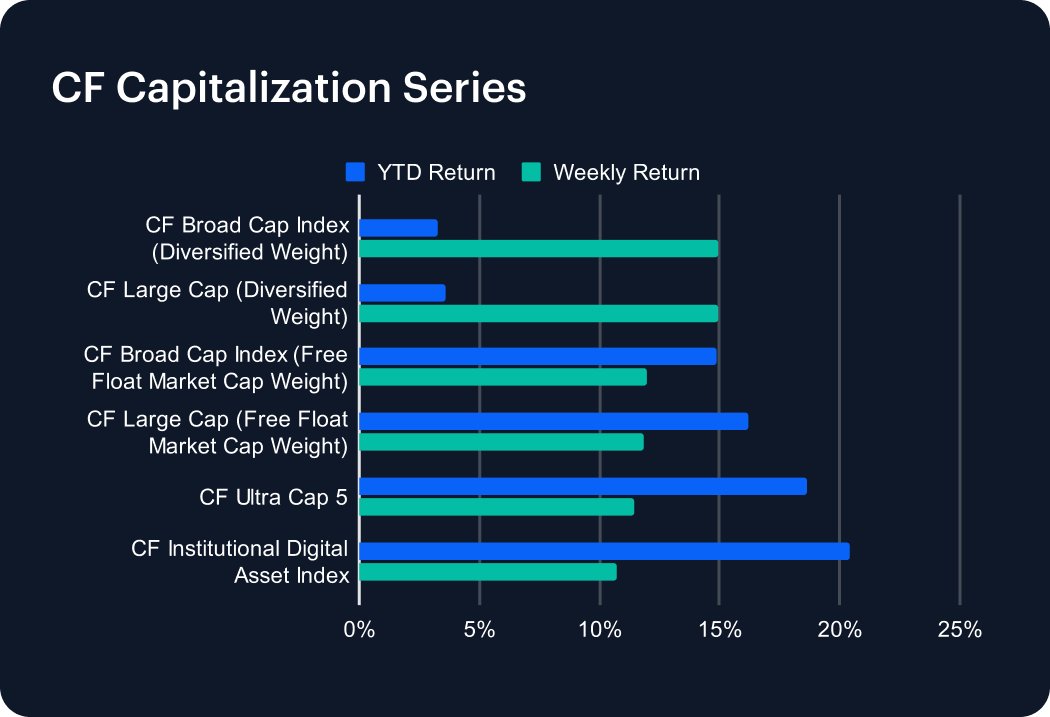
The CF Capitalization Series delivered another punchy rally last week, with double-digit gains across virtually every marquee index. Diversified-weight strategies again stole the show: the CF Broad Cap (Diversified) ripped 14.97%, just nudging the CF Large Cap (Diversified) at 14.96%, flipping both portfolios into modest YTD gains of 3.29% and 3.58%, respectively. Free-float market-cap variants weren’t far behind—the CF Broad Cap (Free-Float) jumped 11.94%, lifting its YTD gain to 14.90%, while the CF Large Cap (Free-Float) climbed 11.85% to 16.22% year-to-date. The CF Ultra Cap 5 followed suit with an 11.45% surge, and the CF Institutional Digital Asset Index added 10.70%, cementing its leadership at 20.39% YTD. Beneath the headlines, improving liquidity and renewed risk appetite are clearly underpinning broader market participation.
Classification Series Analysis
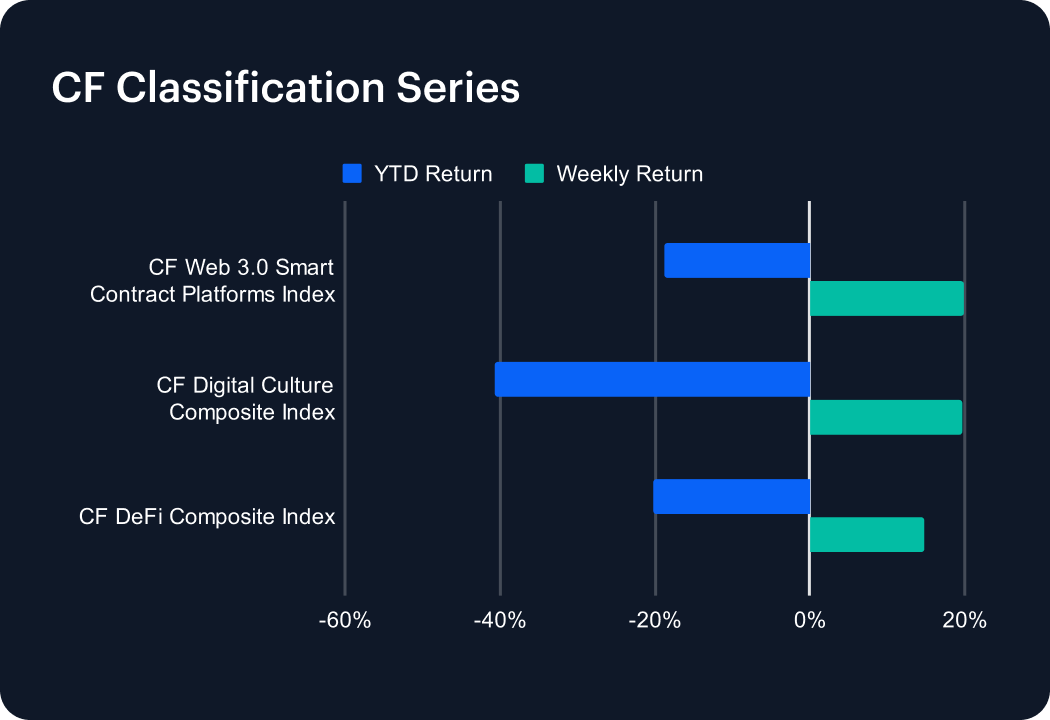
The CF Classification Series extended its robust rebound last week, with every thematic index posting outsized gains. Leading the charge, the CF Web 3.0 Smart Contract Platforms Index rallied by an impressive 19.81%, narrowing its YTD shortfall to 18.84%. The CF Digital Culture Composite Index wasn’t far behind, surging 19.78% and trimming its 2025 decline to 40.75%. Meanwhile, the CF DeFi Composite Index climbed 14.78%, cutting its year-to-date loss to 20.26%. This marks the second straight week of high-beta leadership, signaling renewed risk appetite in thematic segments. Still, steep double-digit drawdowns highlight how much ground remains to be covered before reclaiming early-January peaks.
Volatility
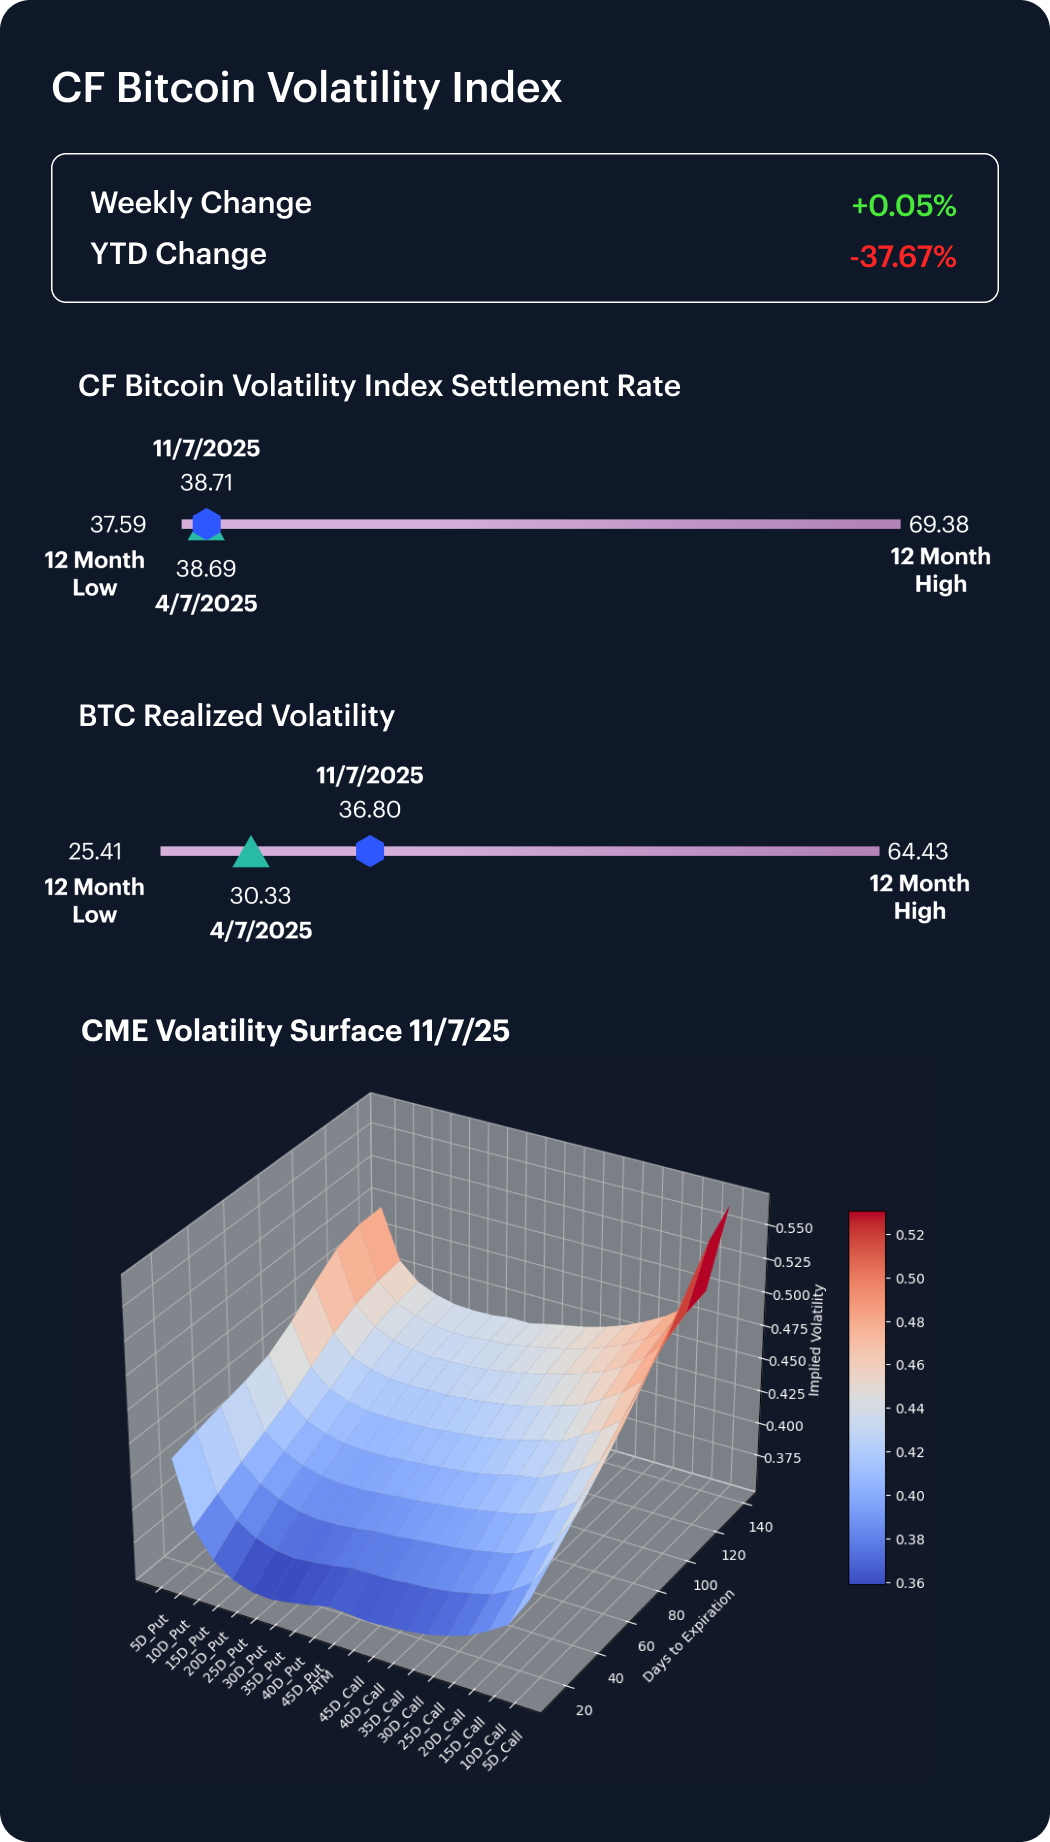
The CF Bitcoin Volatility Index Settlement Rate (BVXS) ticked up 0.05% last week to 38.71, keeping it 37.67% below January 1 levels and hovering just above June’s 12-month trough. Realized volatility jumped to 36.80, up 21.3% on the week, highlighting livelier spot swings even as option premia remain subdued. Crucially, skew across all delta buckets has turned positive, while convexity has increased, steepening the vol curve. Sub-60-day tenors persist as the softest part of the surface, whereas longer maturities continue to trade at a material premium. These dynamics—firmer realized prints, broad-based skew positivity and elevated convexity—suggest market participants are dialing back hedges and resuming directional exposure.
Interest Rate Analysis
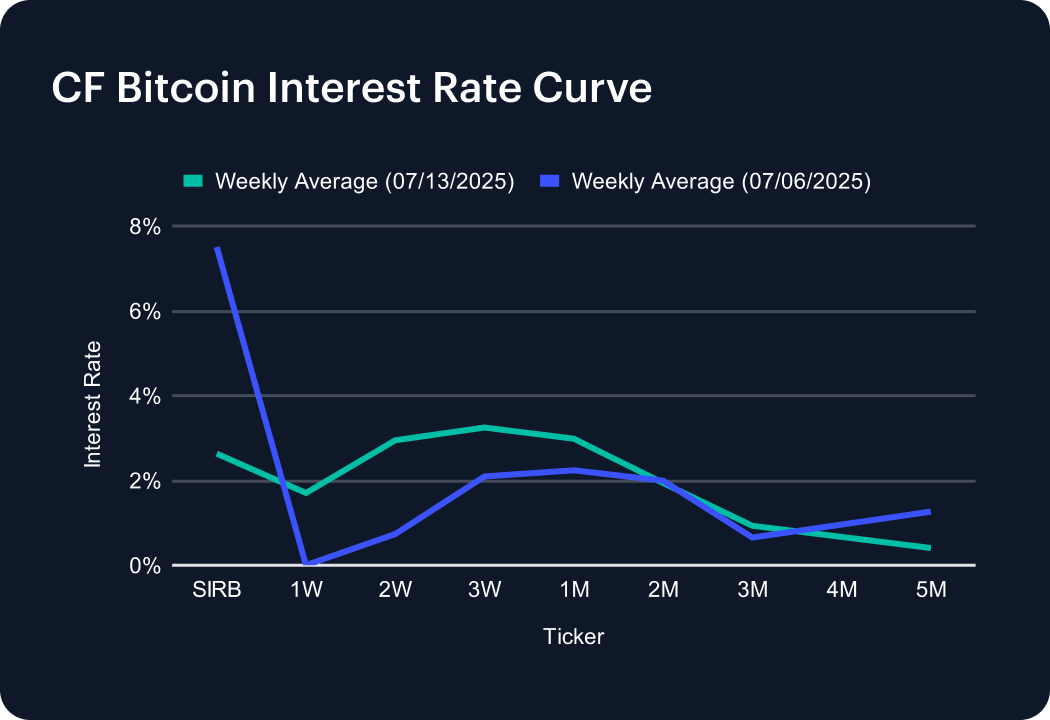
Short-term funding costs collapsed last week as the CF Bitcoin Interest Rate Curve shifted markedly lower at key nodes. The Short-Term Interest Rate Benchmark (SIRB) plunged 487 bps to 2.63%, unwinding nearly all of its prior spike. In contrast, the 1-week tenor surged 170 bps to 1.70%, while 2- and 3-week points climbed 222 bps and 116 bps to 2.95% and 3.25%, respectively, carving a pronounced mid-curve hump. One-month rates rose 74 bps to 2.98%, but tenors beyond two months softened—2-month easing 5 bps to 1.94%, 4-month sliding 29 bps to 0.67%, and 5-month plunging 86 bps to 0.40%—flattening the back end near zero. The result is a sharply lower policy anchor with scattered mid-curve premiums.
The information contained within is for educational and informational purposes ONLY. It is not intended nor should it be considered an invitation or inducement to buy or sell any of the underlying instruments cited including but not limited to cryptoassets, financial instruments or any instruments that reference any index provided by CF Benchmarks Ltd. This communication is not intended to persuade or incite you to buy or sell security or securities noted within. Any commentary provided is the opinion of the author and should not be considered a personalised recommendation. Please contact your financial adviser or professional before making an investment decision.