
Weekly Index Highlights, February 3, 2025
Crypto saw broad declines in the past week, with SOL -9.88% and Avalanche -9.56% leading the losses. ETH staking yields fell to 2.75%, whilst volatility eased with BVXS down to 55.18. The CF BIRC & Cap Series saw sharp declines, reflecting risk-off sentiment & continued institutional repositioning.

Market Performance Update
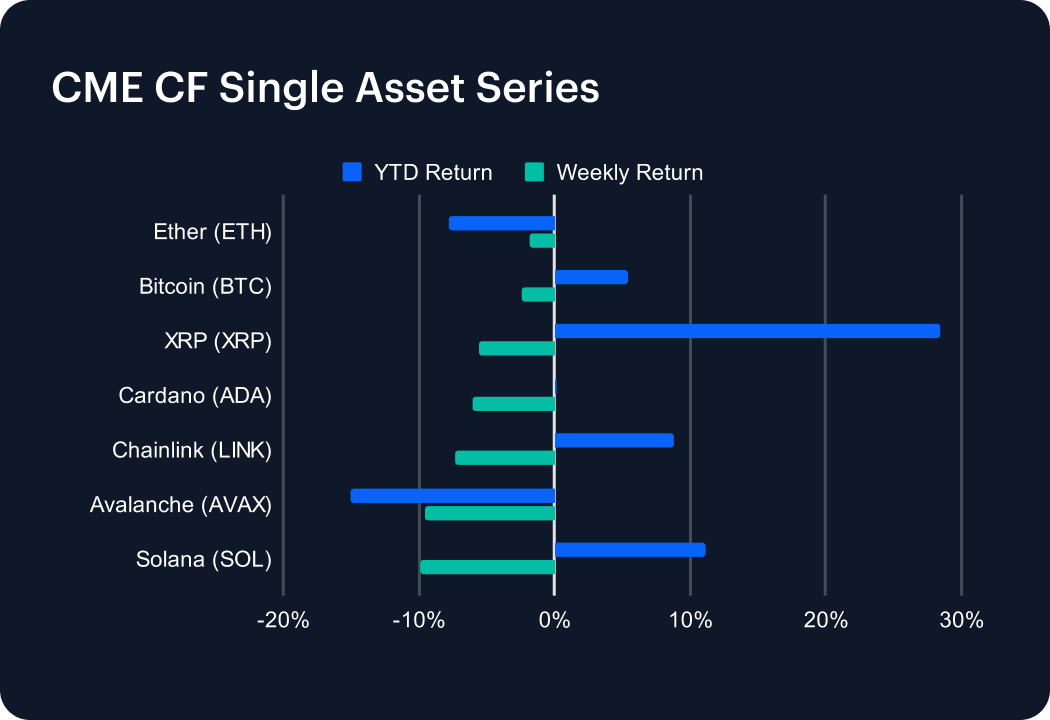
The digital asset market experienced a notable pullback over the past week, with all CME CF Single Asset indices posting declines. Solana (SOL) led the downturn, falling -9.88% weekly, though it holds a YTD return of +11.10%. Avalanche (AVAX) closely followed with a -9.56% drop, bringing its YTD performance to -15.08%. Chainlink (LINK) saw a significant weekly decline of -7.35%, though it retains a YTD gain of +8.78%. XRP (XRP) and Cardano (ADA) posted losses of -5.53% and -6.02%, bringing their YTD returns to +28.44% and +0.16%, respectively. Bitcoin (BTC) and Ether (ETH) also saw declines of -2.39% and -1.85%, with YTD performances of +5.45% and -7.75%.
Sector Analysis
The digital asset market saw a broad decline this week, with leaders and laggards emerging across CF DACS segments. In the Finance sub-category, Borrowing & Lending struggled, with SPELL leading losses at -11.72%, while ONDO showed relative resilience at -2.14%. Asset & Wealth Management saw LDO gain +4.15%, contrasting with YFI’s steep -9.42% drop. Trading platforms and Diversified Financial Services underperformed, with CRV (-14.01%) and AMP (-14.87%) leading declines. Culture assets struggled, particularly in Gaming, where PRIME (-11.68%) and AXS (-11.30%) lagged. Meme Coins were weak, with BONK (-17.40%) dragging the segment. Computing tokens saw the largest losses, with FET (-19.23%) and RNDR (-18.28%) declining sharply. Meanwhile, Settlement tokens were mixed; LTC gained +2.24%, but ALGO (-12.34%) and HBAR (-12.31%) suffered significant drops.
Staking Metrics
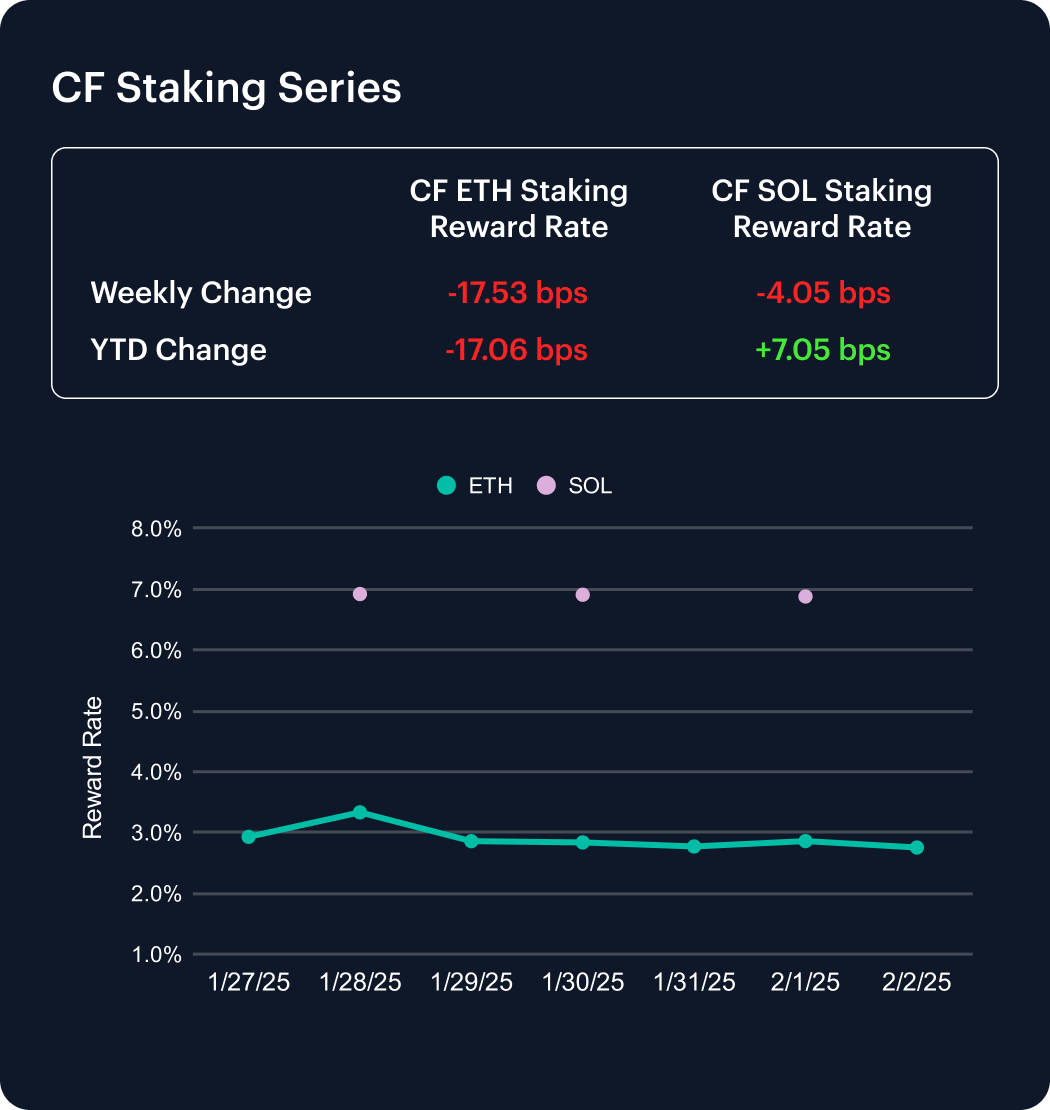
The CF Ether Staking Reward Rate Index (ETH_SRR) declined by -17.53 basis points over the past week, ending at 2.75%, marking a -5.99% weekly drop and a YTD decrease of -5.84%. The index saw fluctuations, peaking at 3.33% before trending downward.
Meanwhile, the CF SOL Staking Reward Rate Index (SOL_SRR) remained relatively stable, dipping slightly by -4.05 basis points to 6.88%, with a modest YTD gain of +7.05 bps. The data highlights continued declines and volatility in Ethereum staking yields, while Solana staking rates exhibited resilience with minor week-over-week fluctuations.
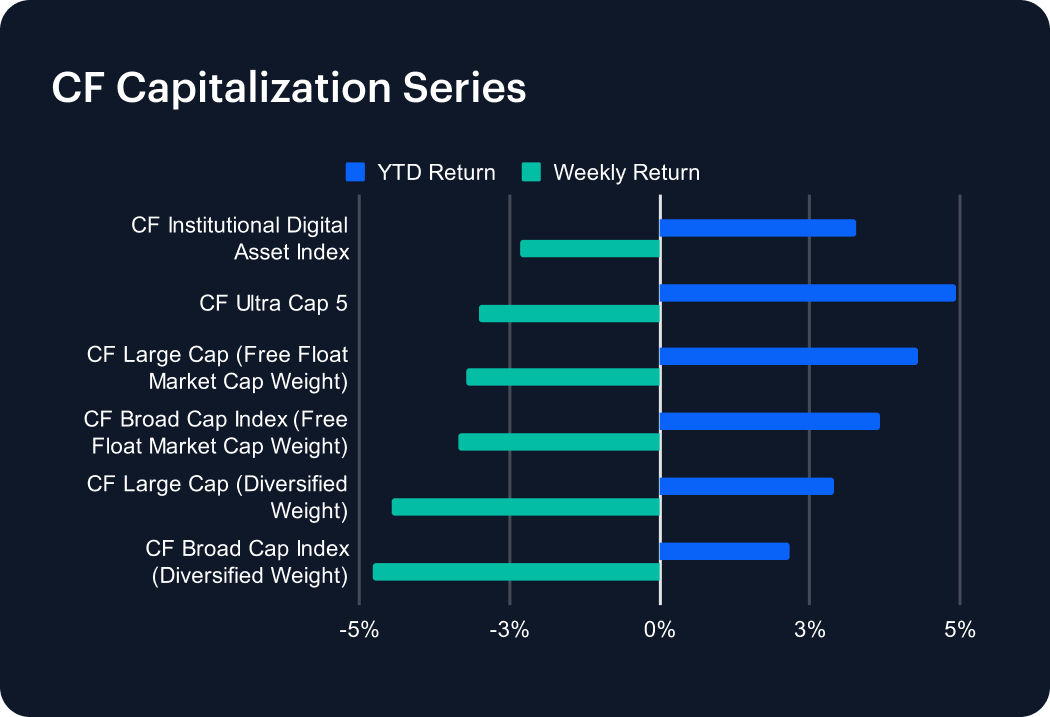
Market Cap Index Performance
Our CF Capitalization Series experienced declines across the board this past week, with diversified weightings underperforming their free float counterparts. The CF Large Cap Index (Diversified Weight) posted a -4.47% weekly loss, bringing its YTD return to +2.90%. The CF Broad Cap Index (Diversified Weight) saw a steeper decline of -4.77%, reducing its YTD performance to +2.17%. Free float market cap-weighted indices fared slightly better, with the CF Large Cap Index and CF Broad Cap Index dropping -3.22% and -3.36%, respectively. The CF Ultra Cap 5 and CF Institutional Digital Asset Index recorded weekly losses of -3.00% and -2.31%. The declines highlight broad market weakness, particularly in diversified-weight indices, despite moderate YTD gains.
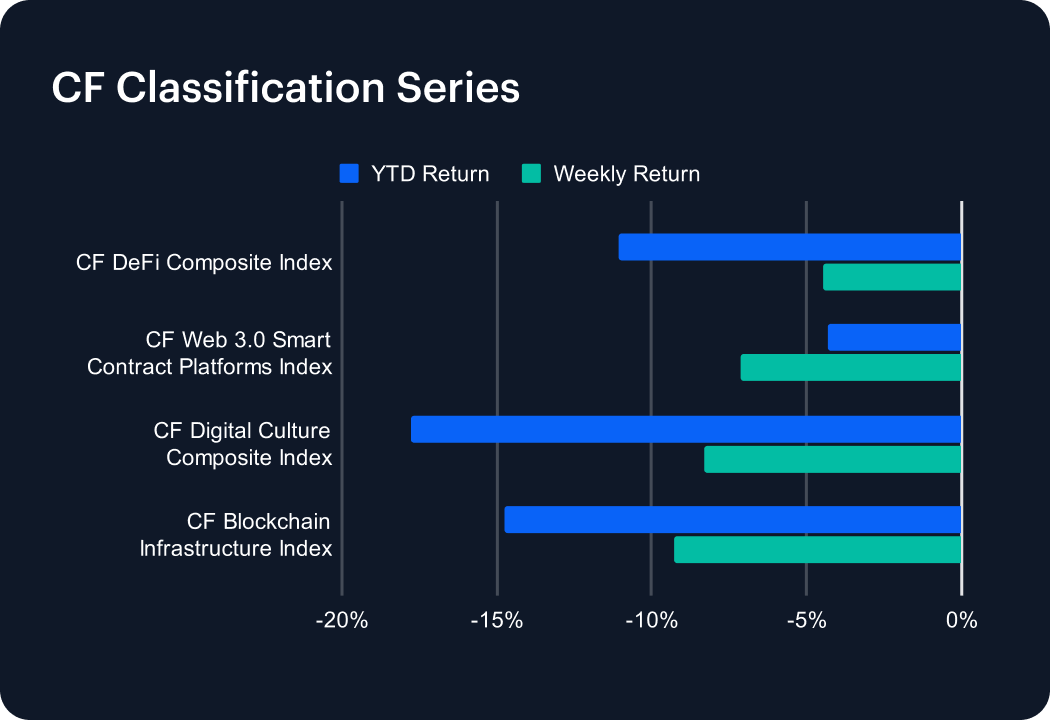
Classification Series Analysis
The CF Classification Series faced broad declines this past week, reflecting persistent headwinds for digital asset verticals. The CF Blockchain Infrastructure Index recorded the steepest drop, falling -9.28% for the week, bringing its YTD return to -14.76%. The CF Digital Culture Composite Index followed closely, declining -8.32%, deepening its YTD loss to -17.79%. The CF Web 3.0 Smart Contract Platforms Index also struggled, posting a -7.12% weekly drop, reducing its YTD performance to -4.34%. Meanwhile, the CF DeFi Composite Index fell -4.46%, extending its YTD decline to -11.09%. The week’s sharp losses highlight ongoing pressure on higher-beta tokens as 2025 progresses, with infrastructure and culture-related assets facing the heaviest setbacks.
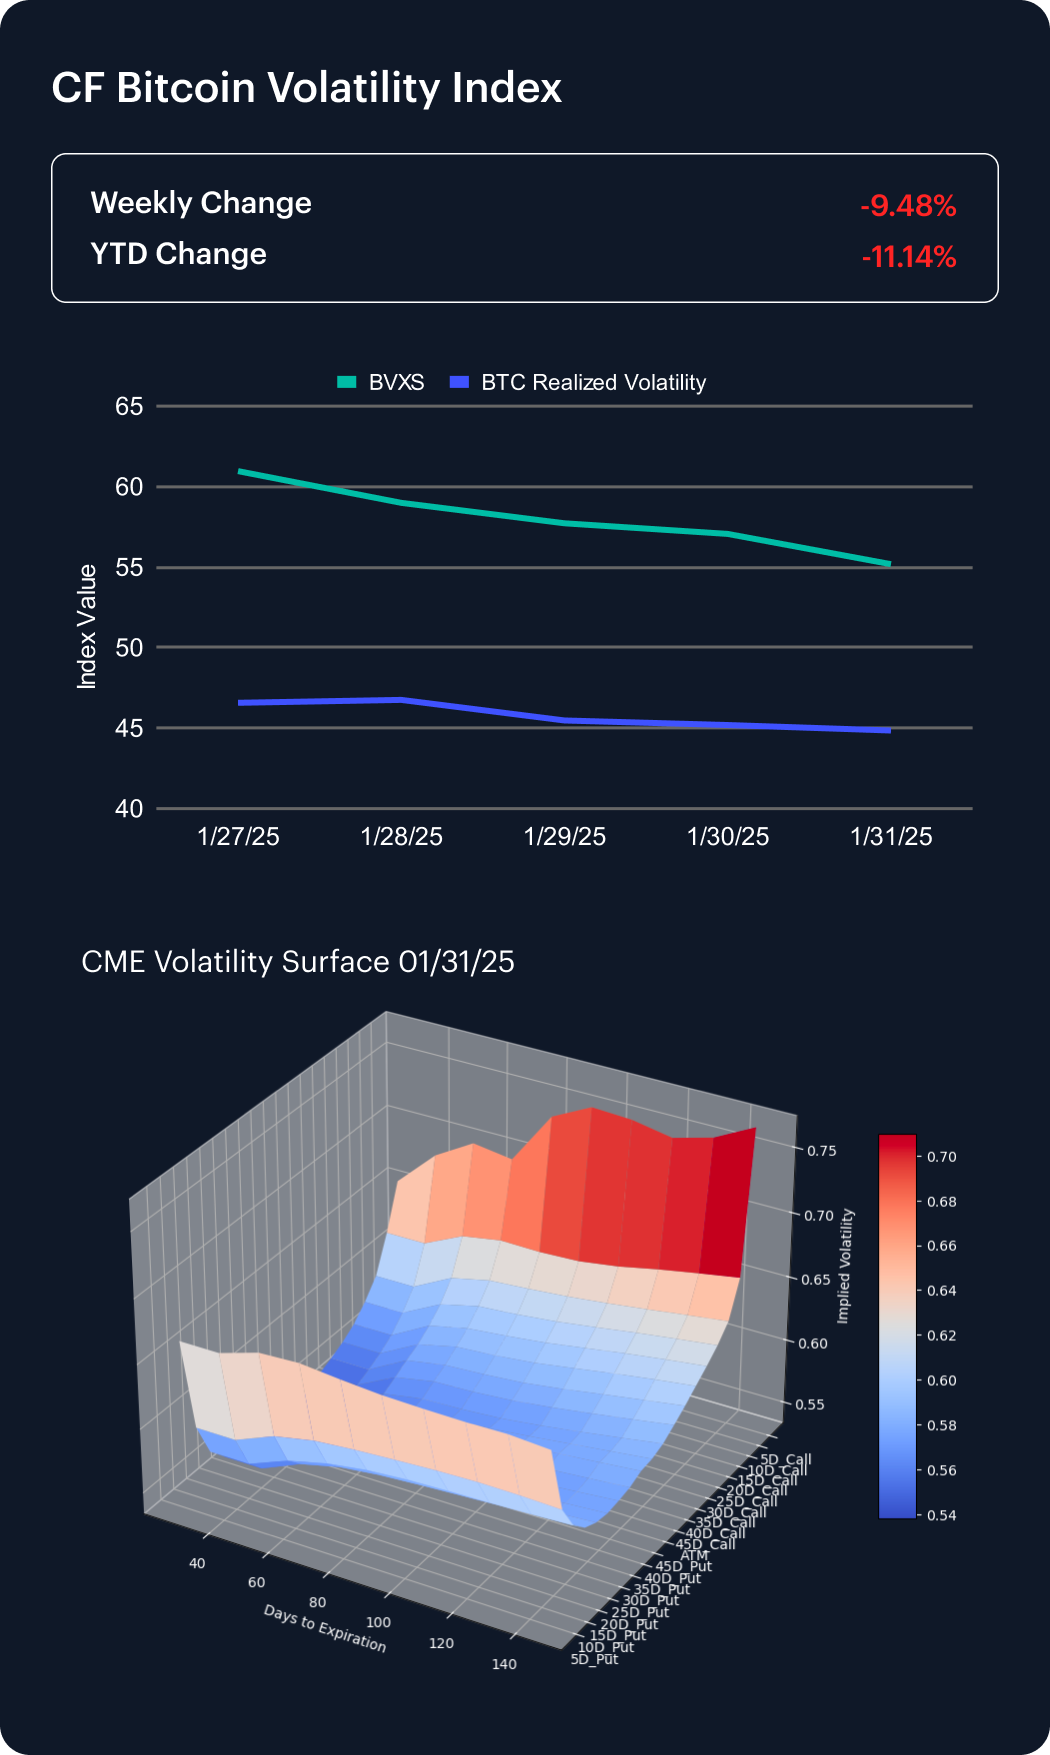
Volatility
The CF Bitcoin Volatility Index Settlement Rate (BVXS) declined significantly over the past week, falling by -9.48% to settle at 55.18. Year-to-date implied volatility metrics also dropped, with an -11.14% YTD change. Realized volatility followed a similar downward trend, beginning the week at 46.57 and ending at 44.85.
An analysis of the CME Bitcoin Volatility Surface reveals increased convexity over the past week, despite a flattening skew across strike ranges as of January 31, 2025. This suggests growing dispersion in market expectations, with traders positioning for potential asymmetric volatility moves. The declines in both implied and realized volatility indicate a shift in sentiment, yet the rise in convexity highlights the potential for sudden market shifts.
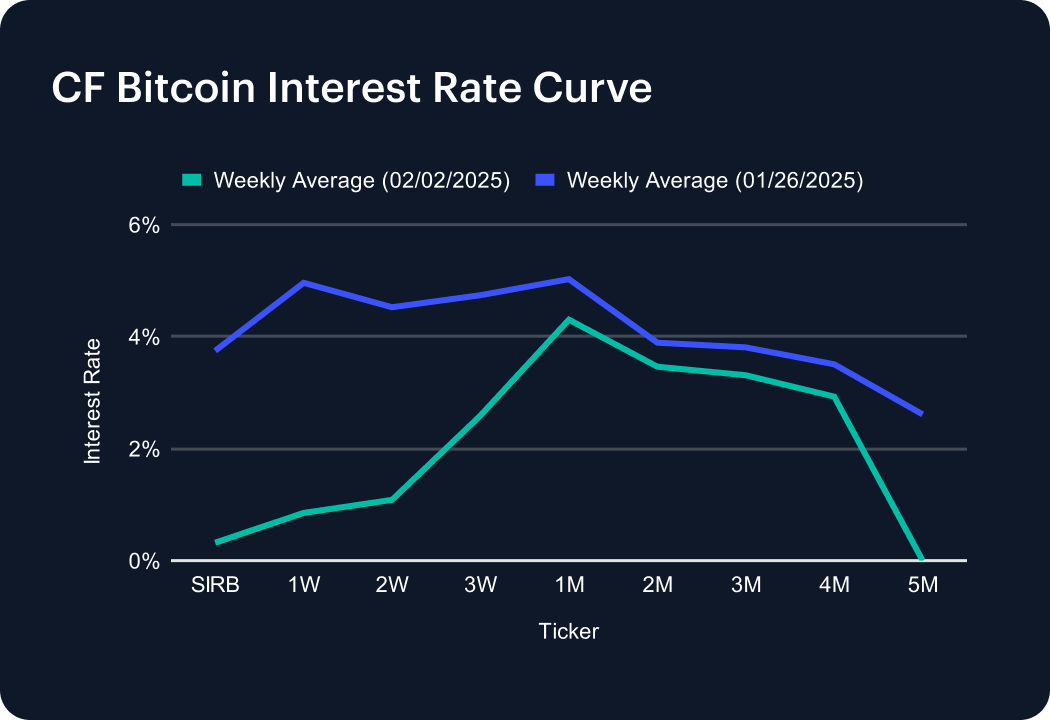
Interest Rate Analysis
The CF Bitcoin Interest Rate Curve saw a sharp repricing across tenors this past week, with significant declines in both short- and medium-term rates. The SIRB dropped to 0.32%, a steep decline from last week’s 3.75%. The 1-Week tenor fell to 0.85% (-411 basis points), while the 2-Week and 3-Week rates declined to 1.09% (-344 basis points) and 2.59% (-215 basis points), respectively. Medium-term tenors also adjusted downward, with the 1-Month rate at 4.30% (-73 basis points) and the 5-Month rate plummeting to 0.00% (-261 basis points). These shifts suggest easing short-term borrowing demand as market participants reassess liquidity needs and risk exposure.
The information contained within is for educational and informational purposes ONLY. It is not intended nor should it be considered an invitation or inducement to buy or sell any of the underlying instruments cited including but not limited to cryptoassets, financial instruments or any instruments that reference any index provided by CF Benchmarks Ltd. This communication is not intended to persuade or incite you to buy or sell security or securities noted within. Any commentary provided is the opinion of the author and should not be considered a personalised recommendation. Please contact your financial adviser or professional before making an investment decision.