
Weekly Index Highlights, February 24, 2025
Sector trends drove select tokens up amid a broad decline. Fantom led (+40.24%), while Immutable X (-15.59%) and CF Digital Culture Index (-7.42%) lagged. Infra tokens fell (-5.80%). ETH staking yields hit 3.01%, SOL 7.04%. BVXS dropped to 48.70 (lower volatility), while SIRB fell to 3.95%.

Market Performance Update
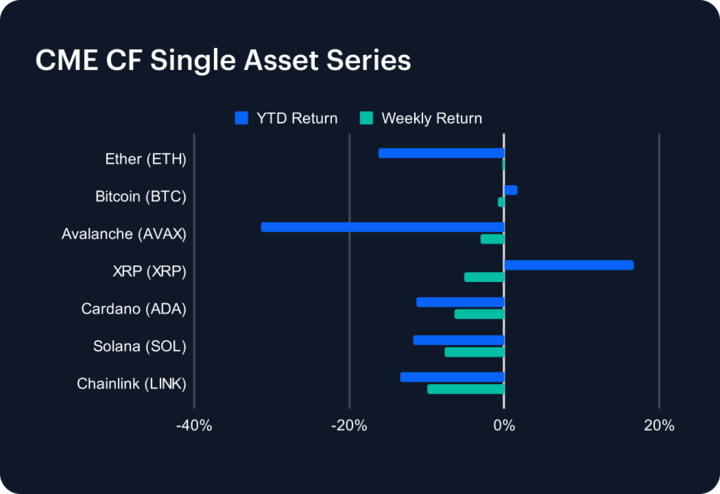
The digital asset market experienced continued volatility over the past week, with most large cap cryptocurrencies posting losses. Chainlink (LINK) led the downturn, dropping -9.98% weekly and extending its YTD decline to -13.39%. Solana (SOL) followed closely, falling -7.71% and deepening its YTD loss to -11.77%. Cardano (ADA) and XRP (XRP) also struggled, slipping -6.41% and -5.14%, respectively. Avalanche (AVAX) shed -3.00% for the week, pushing its YTD loss to -31.44%. Bitcoin (BTC) and Ether (ETH) remained relatively stable but edged lower, with BTC down -0.76% and ETH slipping -0.29%. BTC holds a modest +1.76% YTD gain, while ETH remains -16.28% YTD. Market sentiment remains cautious amid macroeconomic uncertainty.
Sector Analysis
The CF DACS segments saw a mixed performance this week, with standout gains and steep declines. Maker (MKR) dominated the Finance sub-category, soaring +53.83% in Stablecoin Issuance & Management. Fantom (FTM) led the General Purpose Smart Contract Platforms segment with an impressive +40.24%, while Sei (SEI) surged +14.60% among Specialized Purpose Smart Contract Platforms. The Infrastructure sub-category saw Celestia (TIA) rally +18.55% in the Scaling segment, while Helium (HNT) gained +2.05% in Computing. On the downside, the Gaming segment struggled, with Immutable X (IMX) plunging -15.59%, and Axie Infinity (AXS) down -8.88%. Lido DAO (LDO) lagged in Asset & Wealth Management, falling -11.05%. The Meme Coin segment also tumbled, with Pepe (PEPE) down -10.55%.
Staking Metrics
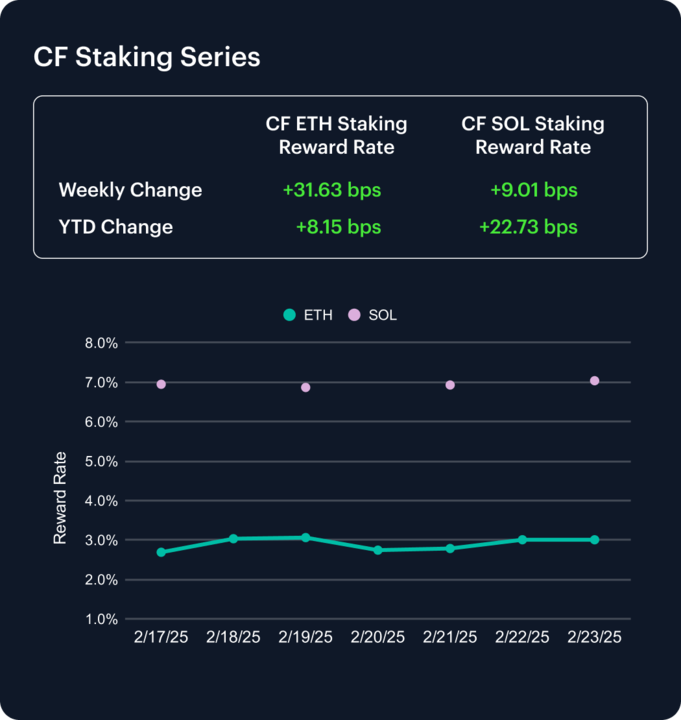
The CF Ether Staking Reward Rate Index (ETH_SRR) rebounded strongly, rising 31.63 basis points over the past week to 3.01%, reflecting an 11.77% weekly increase and a YTD increase of 8.15 bps. The reward rate fluctuated significantly, peaking at 3.06% before slightly retreating.
Meanwhile, the CF SOL Staking Reward Rate Index (SOL_SRR) maintained its upward trajectory, climbing 9.01 basis points to 7.04%, marking a 1.30% weekly gain and a 22.73 bps YTD increase. These shifts highlight Ethereum’s strong rebound in staking yields while Solana continues its steady growth, reflecting an increase in network activity across the board.
Market Cap Index Performance
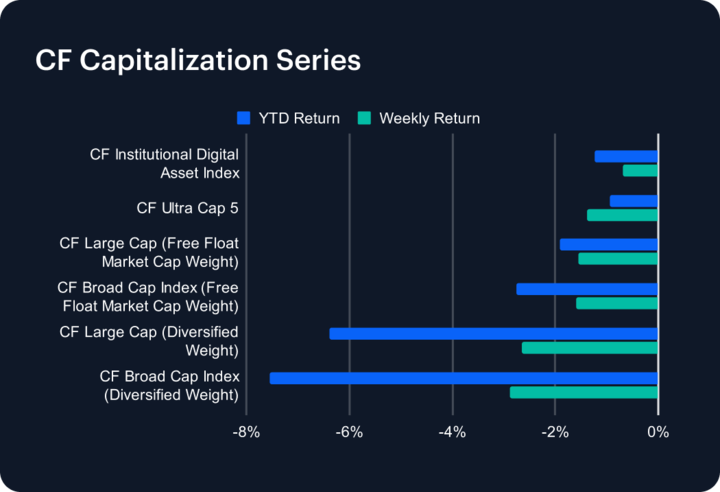
Our CF Capitalization Series saw broad-based declines this past week, with free-float market cap-weighted indices faring slightly better than their diversified-weighted counterparts. The CF Broad Cap Index (Diversified Weight) led the downturn, dropping -2.89% for the week, deepening its YTD loss to -7.54%. The CF Large Cap Index (Diversified Weight) followed closely, declining -2.66% and extending its YTD decline to -6.38%. Meanwhile, free-float market cap-weighted indices also struggled, with the CF Broad Cap Index and CF Large Cap Index down -1.59% and -1.55%, respectively. The CF Ultra Cap 5 fell -1.39%, while the CF Institutional Digital Asset Index posted the smallest loss at -0.69%. Market sentiment remains fragile, with large-cap assets exhibiting relative resilience amid broad corrections.
Classification Series Analysis
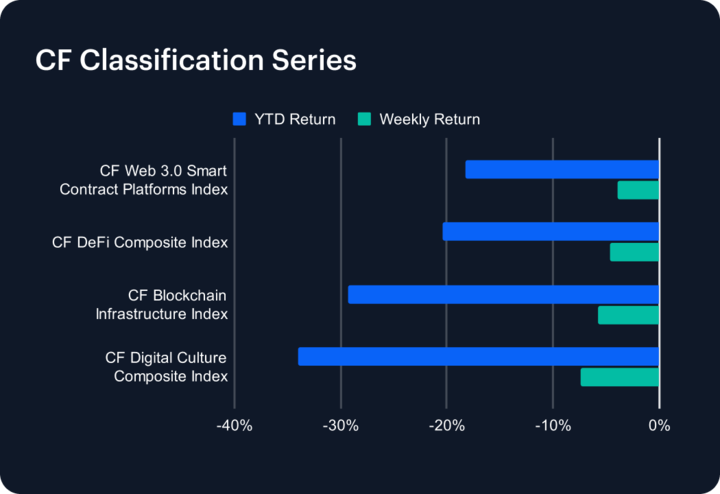
The CF Classification Series saw broad declines this past week, indicating continued pressure across digital asset verticals. The CF Digital Culture Composite Index led losses, tumbling -7.42%, deepening its YTD decline to -34.01%. The CF Blockchain Infrastructure Index followed with a -5.80% drop, pushing its YTD performance further down to -29.32%. Meanwhile, the CF DeFi Composite Index slid -4.63%, now down -20.42% for the year. The CF Web 3.0 Smart Contract Platforms Index saw a relatively smaller decline of -3.93%, extending its YTD loss to -18.30%. This week’s downturn highlights persistent challenges in the sectors, as sentiment remains weak and broader market conditions continue to weigh on small cap digital assets.
Volatility Index
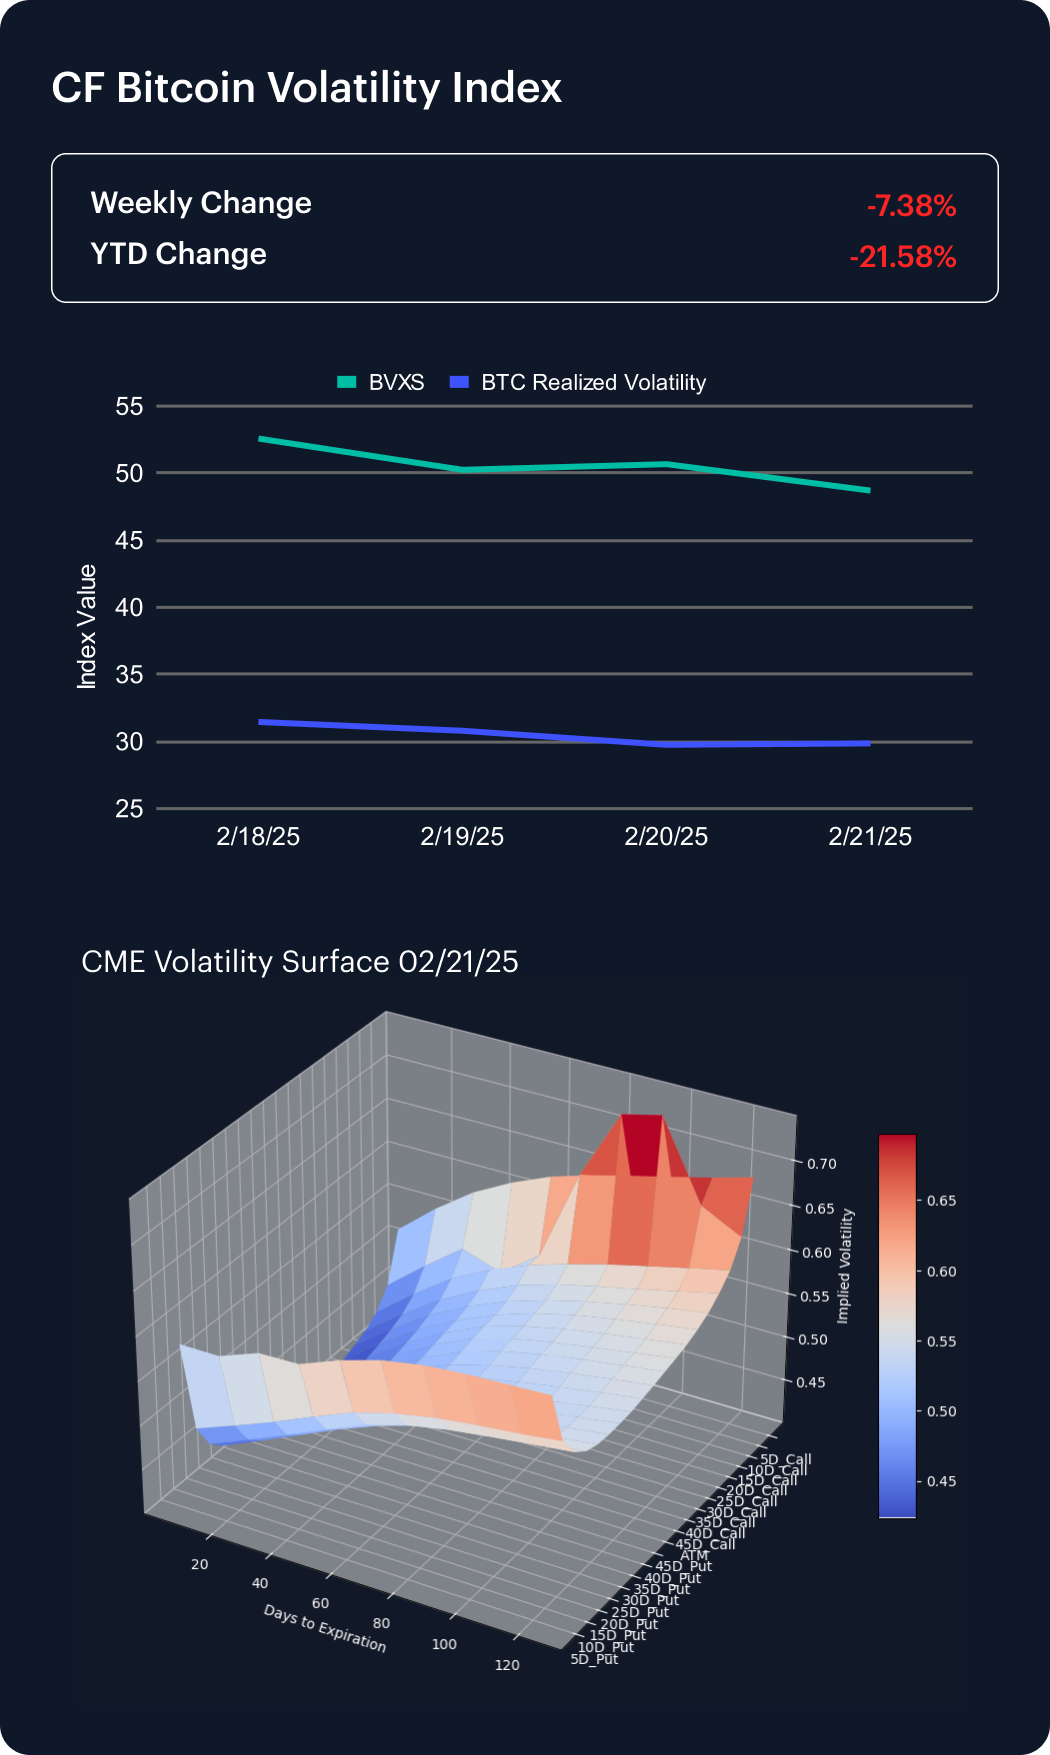
The CF Bitcoin Volatility Index Settlement Rate (BVXS) continued its downward trend this past week, declining -7.38% to settle at 48.70, deepening its YTD decline to -21.58%. Realized volatility also trended lower, starting the week at 31.46 and ending at 29.86, signaling a continued reduction in short-term price fluctuations.
An analysis of the CME Bitcoin Volatility Surface indicates that while convexity remains elevated, implied volatility has declined across the board for shorter-dated options relative to longer-dated ones. This suggests elevated demand for long-term downside protection and upside exposure. Additionally, a continued flattening of the skew across strike ranges reflects more neutral sentiment, though the sustained convexity highlights the potential for sudden price swings as option sensitivity to price changes remains pronounced.
Interest Rate Analysis
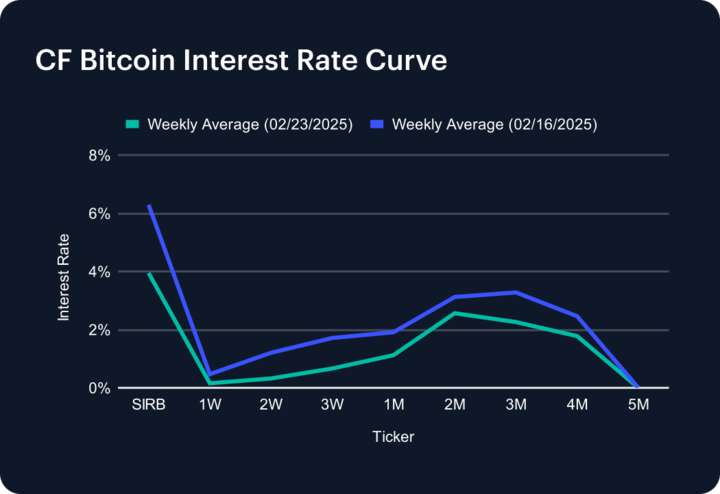
The CF Bitcoin Interest Rate Curve saw a broad decline this past week, with short-term rates easing and medium-term tenors adjusting lower. The SIRB dropped sharply to 3.95%, down from 6.29% the previous week, reflecting a decrease in short-term borrowing costs. The 1-Week and 2-Week rates fell to 0.16% and 0.32%, respectively, while the 3-Week and 1-Month tenors declined to 0.66% and 1.12%. Medium-term tenors also softened, with the 2-Month and 3-Month rates decreasing to 2.56% and 2.26%, while the 4-Month rate declined to 1.78%. These shifts indicate loosening liquidity conditions and reduced borrowing demand across maturities.
The information contained within is for educational and informational purposes ONLY. It is not intended nor should it be considered an invitation or inducement to buy or sell any of the underlying instruments cited including but not limited to cryptoassets, financial instruments or any instruments that reference any index provided by CF Benchmarks Ltd. This communication is not intended to persuade or incite you to buy or sell security or securities noted within. Any commentary provided is the opinion of the author and should not be considered a personalised recommendation. Please contact your financial adviser or professional before making an investment decision.