
Weekly Index Highlights, April 28, 2025
Big news! CF Benchmarks won Index Provider of the Year from ETF.com. In the same week, digital assets rebounded sharply, with diversified indices outperforming their free-float counterparts, and Bitcoin volatility fell as sentiment improved.

Market Performance Update
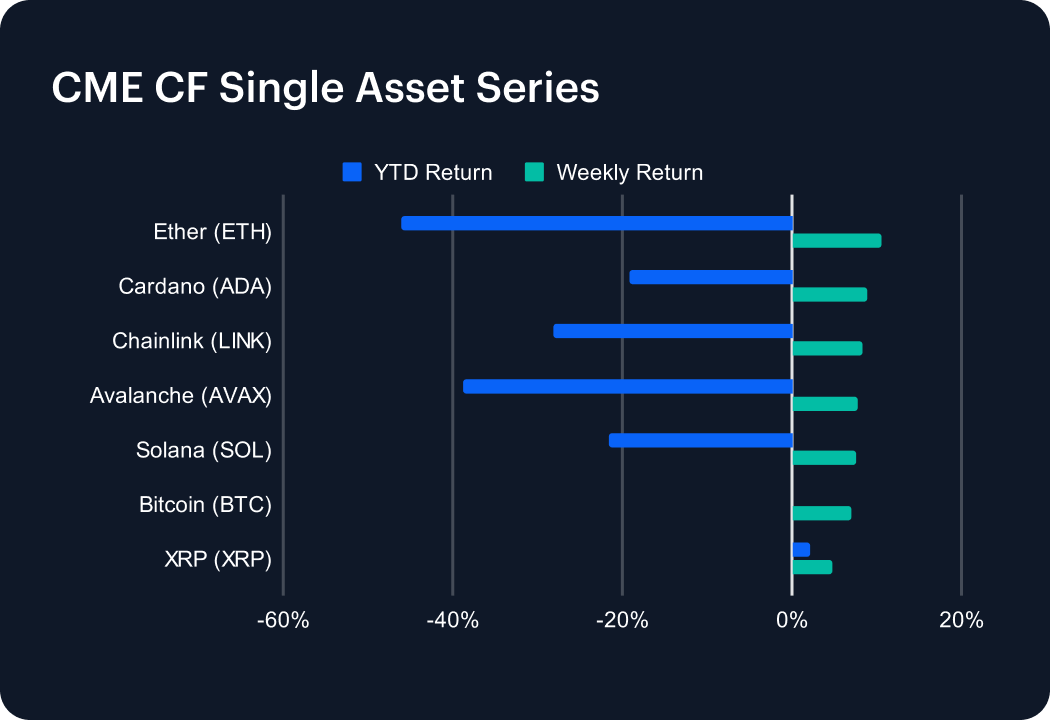
The digital asset market rebounded sharply this week, reversing recent losses as major tokens posted strong gains. Ether (ETH) surged 10.65%, trimming its year-to-date (YTD) loss to -46.06%. Cardano (ADA) jumped 8.81%, narrowing its YTD decline to -19.12%. Chainlink (LINK) climbed 8.31%, now down -28.11% YTD. Avalanche (AVAX) gained 7.71%, easing its YTD slide to -38.87%. Solana (SOL) rose 7.50%, improving its YTD return to -21.64%. Bitcoin (BTC) advanced 6.98%, turning positive for the year at 0.10%. XRP (XRP) increased 4.85%, building on gains to reach a 2.06% YTD return. Overall, sentiment improved notably as buyers stepped back into the market, offering a much-needed relief rally after months of persistent weakness.
Sector Analysis
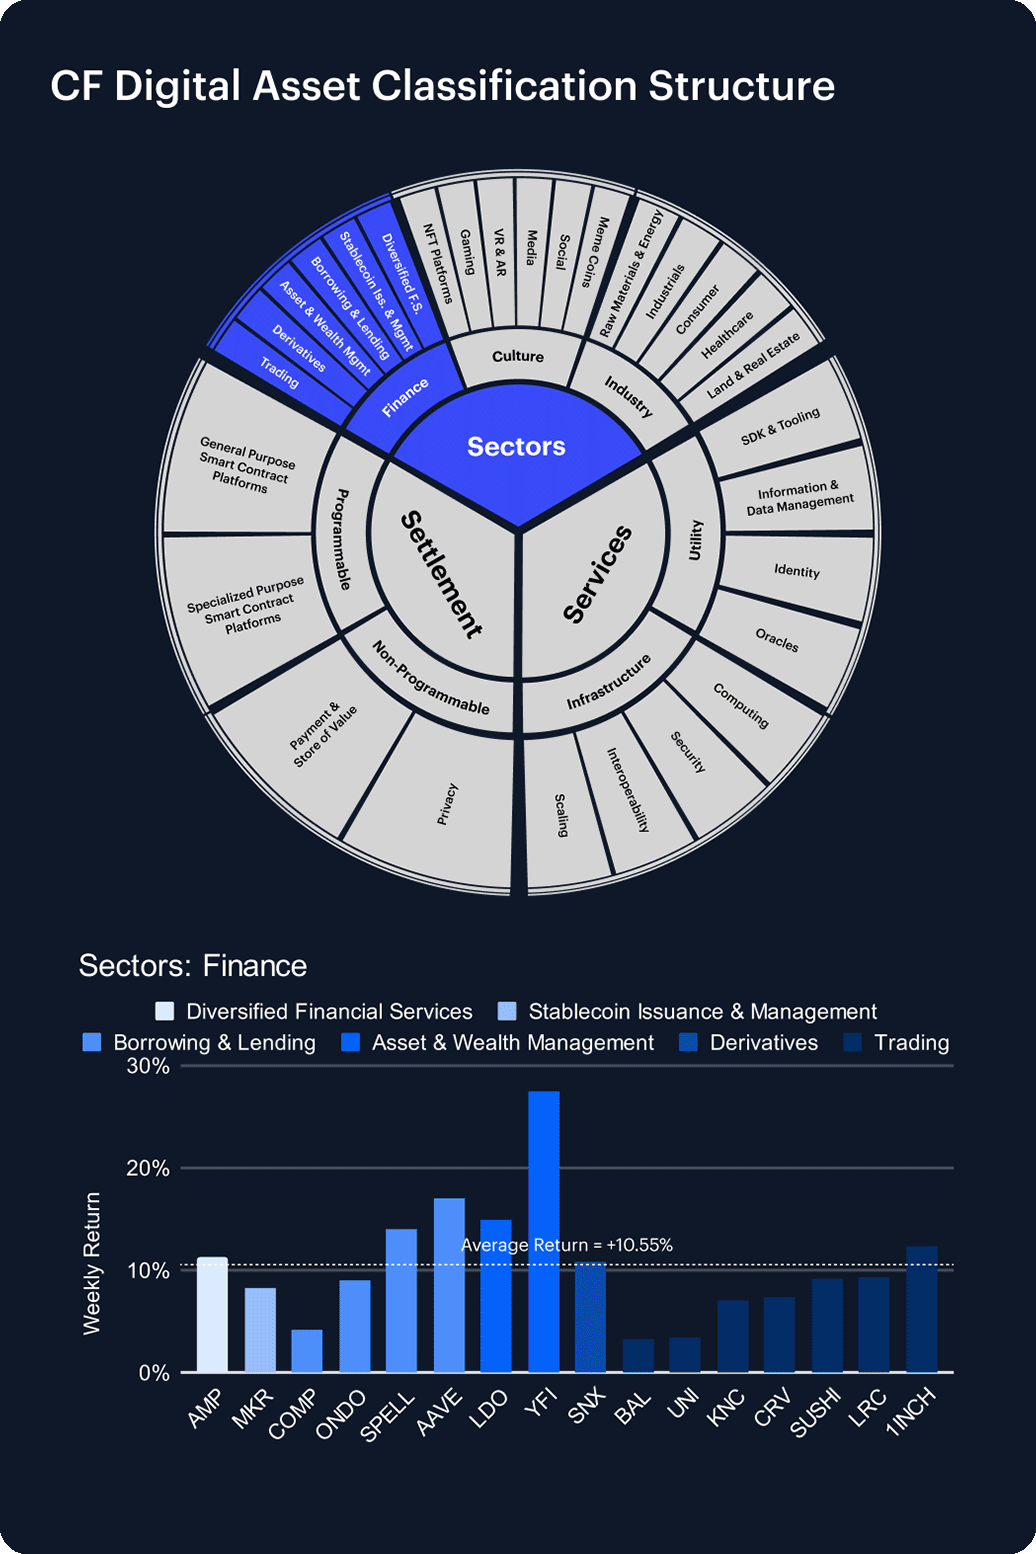
Multiple segments showed strength as digital assets rallied. In Computing, HNT jumped 23.23% and FET rose 16.66%, while RENDER slipped 0.29%. SDK & Tooling was strong, led by BICO (+16.06%) and ANKR (+6.53%). Culture tokens saw broad gains, with SUPER surging 23.17% and IMX adding 18.00%. Meme Coins staged a major comeback, highlighted by BONK (+47.64%) and WIF (+41.69%). In Infrastructure, STX soared 23.88%, while SKL was a notable laggard, dropping 7.69%. Trading names rallied, with 1INCH (+12.36%) and LRC (+9.33%) outperforming. Tokens in the Asset & Wealth Management segment like YFI (+27.49%) also posted outsized gains. Within programmable smart contract platforms, SUI skyrocketed 59.75%, far outpacing other General Purpose Smart Contract Platforms.
Staking Metrics
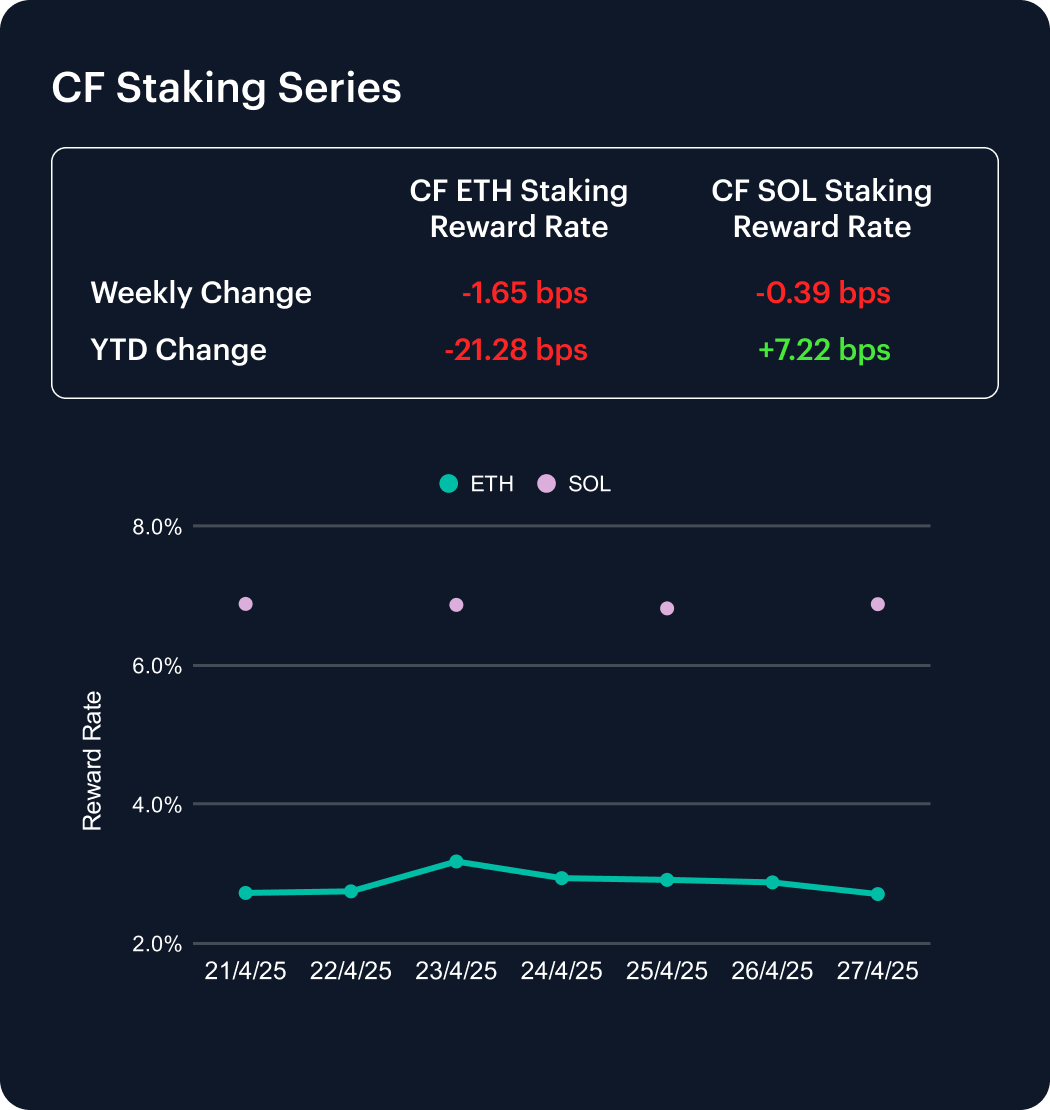
The CF Ether Staking Reward Rate Index (ETH_SRR) decreased again this week, falling 1.65 basis points to 2.71%, a 0.61% weekly decline. Year-to-date, ETH_SRR is down 21.28 bps, reflecting a 7.28% cumulative decrease and highlighting ongoing pressure on Ethereum staking yields.
Meanwhile, the CF SOL Staking Reward Rate Index (SOL_SRR) held relatively steady, dipping just 0.39 bps to 6.88%, a marginal 0.06% decrease for the week. SOL_SRR remains up 7.22 bps year-to-date, a 1.06% gain. The continued divergence underscores Ethereum’s persistent reward compression versus Solana’s comparatively resilient staking environment.
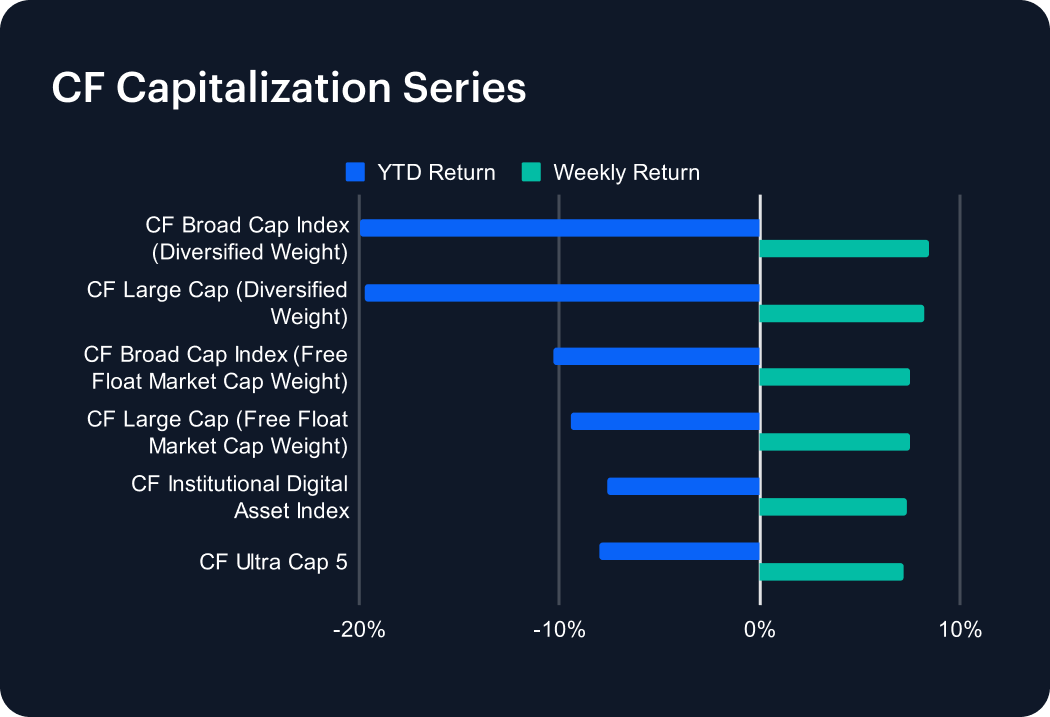
Market Cap Index Performance
The CF Capitalization Series rallied this week, with gains across all indices amid a broad market recovery. Diversified-weighted indices modestly outpaced their free-float market cap-weighted counterparts, reversing the recent trend. The CF Large Cap Index (Diversified Weight) climbed 8.22%, trimming its year-to-date (YTD) loss to -19.72%, while the CF Broad Cap Index (Diversified Weight) gained 8.42%, improving its YTD return to -19.95%. Among free-float market cap-weighted indices, the CF Broad Cap and CF Large Cap indices rose 7.55% and 7.49%, respectively. The CF Ultra Cap 5 advanced 7.20%, while the CF Institutional Digital Asset Index was up 7.33%. The week’s performance highlights a renewed appetite for exposure to small-cap tokens, with diversified-weighted indices showing slightly stronger momentum.
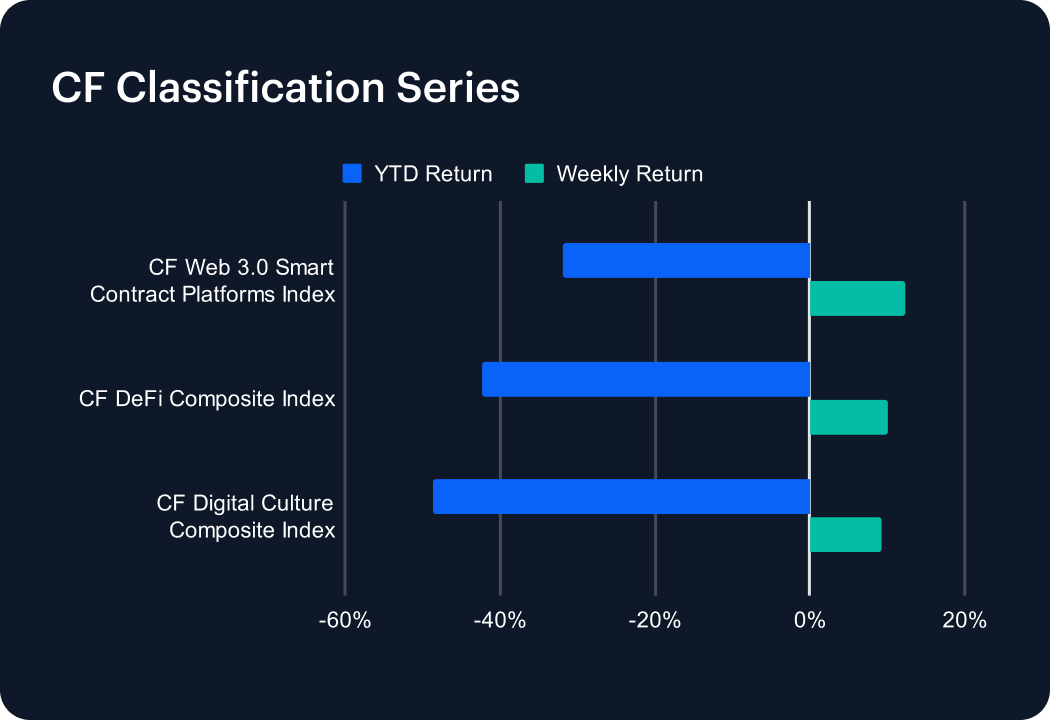
Classification Series Analysis
The CF Classification Series Indices advanced this week, with several key digital asset verticals outperforming the broad market. The CF Web 3.0 Smart Contract Platforms Index led the rally with a 12.28% weekly gain, trimming its year-to-date (YTD) loss to -31.85%. The CF DeFi Composite Index rose 10.08%, narrowing its YTD decline to -42.39%. Meanwhile, the CF Digital Culture Composite Index gained 9.20%, though it remains the weakest performer in 2025 with a cumulative loss of -48.63%. This week’s rebound highlights improving sentiment in smaller-cap and thematic segments. While overall losses remain steep year-to-date, the sharp recovery suggests that speculative appetite is reviving, at least temporarily, within more volatile digital asset sectors.
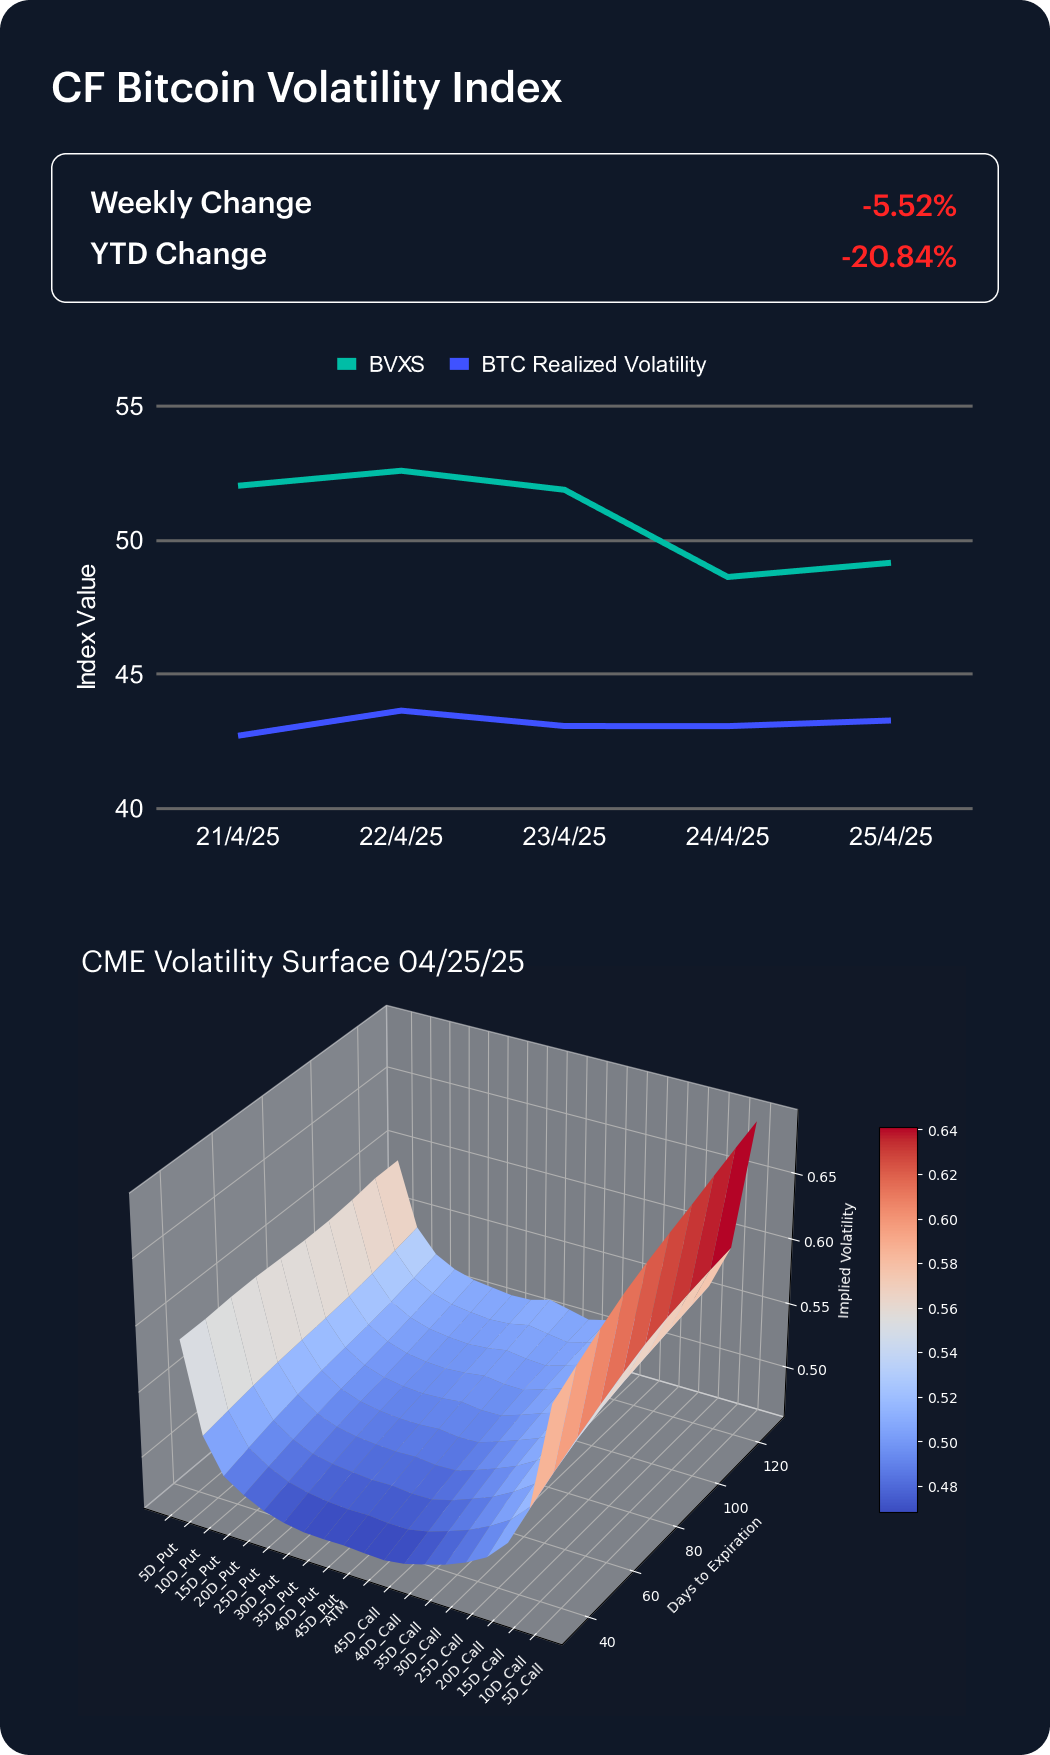
Volatility
The CF Bitcoin Volatility Index Settlement Rate (BVXS) fell 5.52% over the past week, closing at 49.16 and extending its year-to-date decline to 20.84%. This continued drop in implied volatility reflects a sustained easing in long-term market uncertainty. Meanwhile, realized volatility held steady, ticking slightly higher from 42.71 to 43.28, indicating stable short-term price movement with a modest increase in realized price swings.
CME Bitcoin Volatility Surface data shows positive skew persisting across the 10, 15, 20, and 25 delta points, alongside greater convexity in the curve this week. Additionally, there has been a notable rise in implied volatility for long-dated 5-delta calls, suggesting increasing investor interest in positioning for a significant move to the upside.
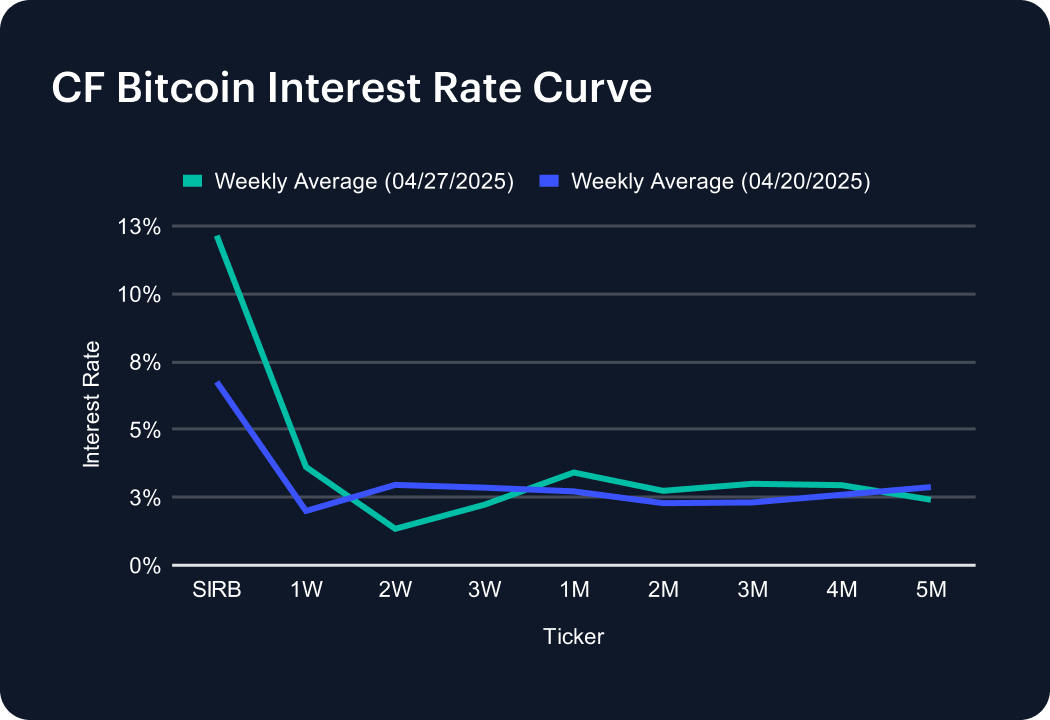
Interest Rate Analysis
The CF Bitcoin Interest Rate Curve shifted sharply higher this past week, driven by a surge in short-term borrowing costs. The Short-Term Interest Rate Benchmark (SIRB) jumped to 12.15% from 6.76%, reflecting intensified demand for immediate funding. Short-dated tenors rose meaningfully, with the 1-week rate climbing to 3.62%, the 2-week rate up to 1.34%, and the 3-week rate at 2.23%. One-month funding also increased to 3.41%. Further out, 2- to 4-month rates moved higher, while the 5-month tenor edged lower to 2.41%. The steepening across the curve’s front end suggests renewed leverage demand, although longer-term appetite remains more measured.
The information contained within is for educational and informational purposes ONLY. It is not intended nor should it be considered an invitation or inducement to buy or sell any of the underlying instruments cited including but not limited to cryptoassets, financial instruments or any instruments that reference any index provided by CF Benchmarks Ltd. This communication is not intended to persuade or incite you to buy or sell security or securities noted within. Any commentary provided is the opinion of the author and should not be considered a personalised recommendation. Please contact your financial adviser or professional before making an investment decision.