
Revisiting the Bitcoin Basis: How Momentum & Sentiment Impact the Structural Drivers of Basis Activity
Bitcoin’s futures basis reflects shifts in price momentum and market sentiment. Shared benchmarks between spot ETFs and CME futures contracts have enabled efficient arbitrage and driven increased institutional participation.

The CME Bitcoin futures basis is primarily driven by price momentum and market sentiment, which may be derived from both macroeconomic and idiosyncratic factors. Market structure dynamics allow sophisticated institutional traders to capitalize on predictable patterns where aggressive Bitcoin price expansion and bullish sentiment create a positive basis, while aggressive price declines and bearish sentiment drive a negative basis. This momentum- and sentiment-driven relationship, supported by aligned pricing benchmarks between spot ETFs and futures, has fundamentally transformed Bitcoin derivatives markets.
The alignment of pricing benchmarks between spot Bitcoin ETFs and CME futures contracts has created the foundation for sentiment-driven arbitrage strategies to thrive. Most U.S.-listed spot Bitcoin ETFs calculate their Net Asset Value (NAV) using the CME CF Bitcoin Reference Rate – New York Variant (BRRNY), while CME futures contracts settle against the London variant (BRR) of the same index. This shared benchmark effectively ties the regulated spot and futures markets together, ensuring that basis trades can be executed with minimal tracking error. By reducing execution risk and eliminating NAV drift, this price singularity strengthens liquidity and facilitates scalable arbitrage strategies, particularly during momentum-driven periods when sentiment extremes widen the futures premium or discount. In practice, this linkage has transformed Bitcoin's derivatives landscape, enabling traders to systematically exploit pricing dislocations while reinforcing the broader market's efficiency.
Understanding the Fundamentals of Basis Trades
A basis trade involves taking simultaneous positions in the spot market and the futures market for the same underlying asset. The basis itself is the difference between the futures price and the spot price. The objective of a basis trade is to profit from this basis as the spot and futures prices naturally converge by the expiration date of the futures contract.
When the futures price is higher than the spot price (a situation known as contango), traders will buy the underlying asset in the spot market and simultaneously sell (short) the corresponding futures contract. Conversely, when the futures price is lower than the spot price (in backwardation), traders will sell (or short) the asset in the spot market and buy the corresponding futures contract.
Figure 1 illustrates contango, where longer-term futures trade at higher prices than shorter-term contracts. In this example, the basis widens from 2 to 15 as the time to maturity extends from 1 to 12 months, highlighting the divergence between spot and futures prices and the resulting arbitrage opportunities for basis traders.
Figure 1: Futures Curve in Contango (Source: CF Benchmarks)
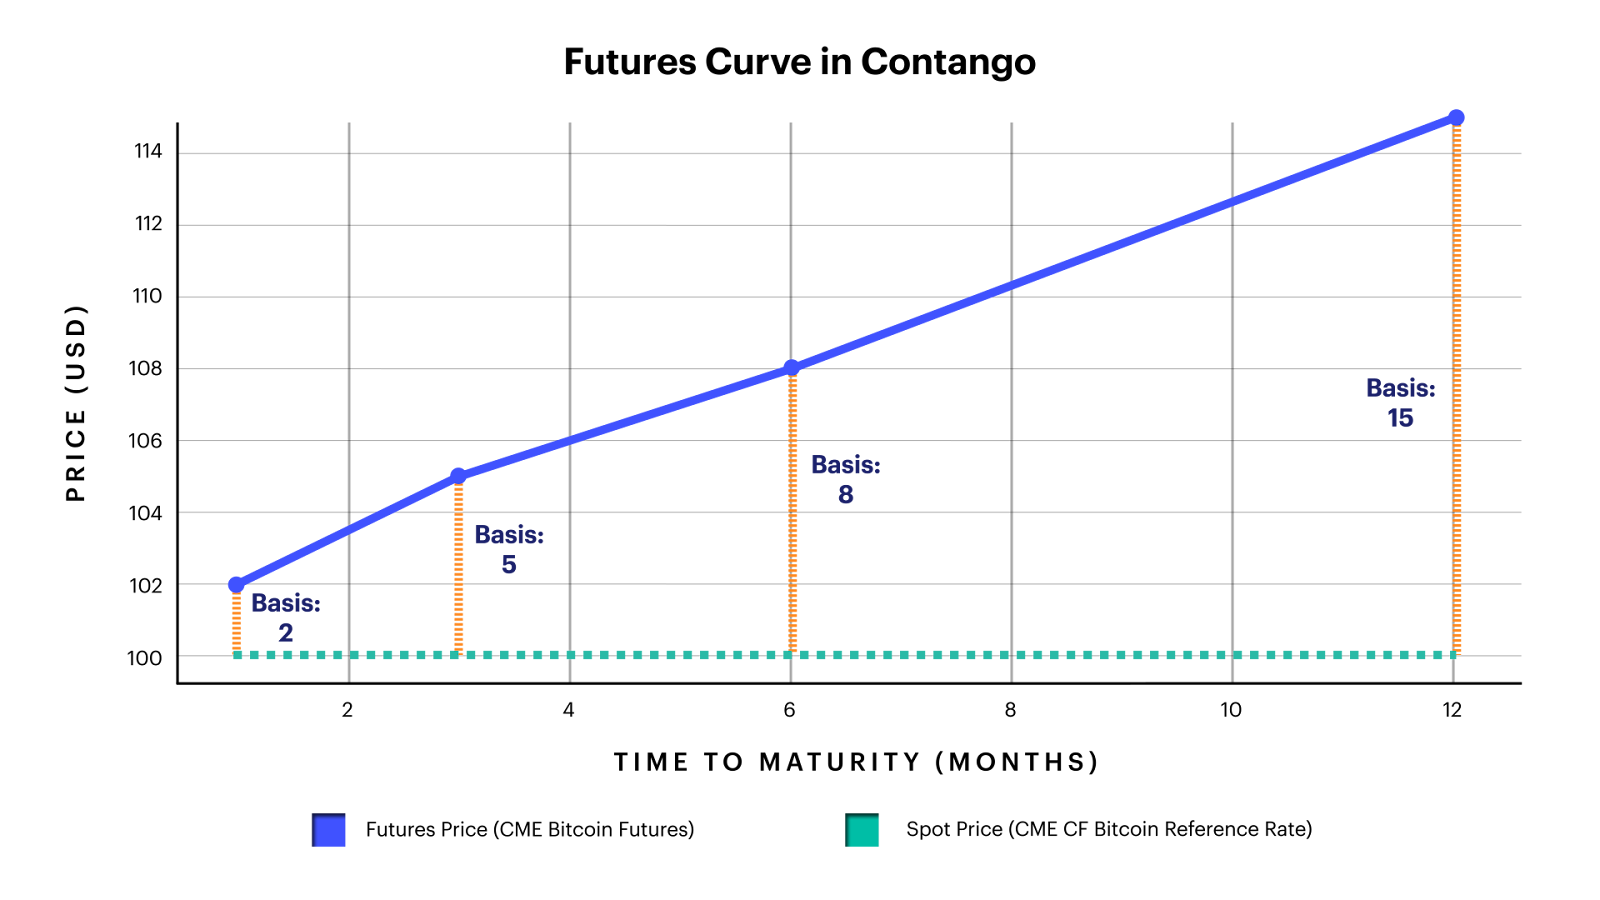
In Bitcoin markets, basis trades typically occur during periods of contango, when futures trade at a premium to spot prices. This persistent contango structure reflects the positive carry that institutional traders can capture by shorting futures against long spot positions. The ability to access regulated spot exposure through ETFs while simultaneously shorting CME futures has made this strategy increasingly accessible and popular among institutional participants. While backwardation does occasionally occur during extreme bearish sentiment or market stress, these periods are relatively rare and short-lived, making contango-based strategies the dominant form of basis trading in the Bitcoin derivatives ecosystem.
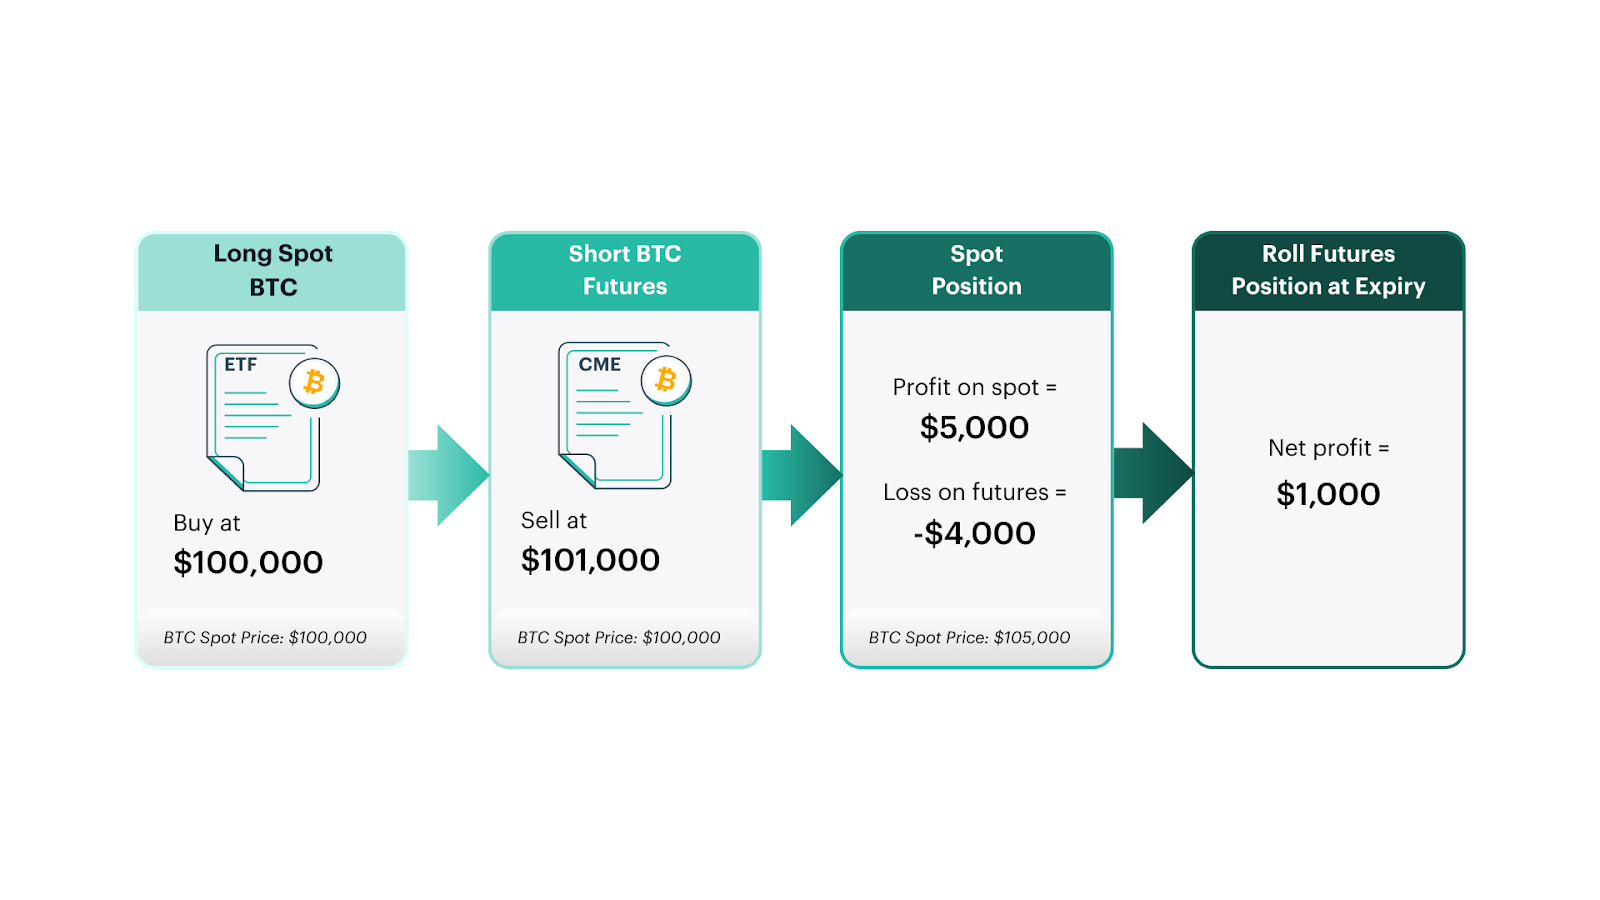
The key characteristic of this strategy is that it creates a delta-neutral position, meaning the combined effect of, for example, a long spot position and a short futures position ideally neutralizes exposure to the underlying asset’s directional price movements. The goal is to “lock in” the initial basis, with profit (or loss) realized as spot and futures prices converge at expiration. For example, consider the contango scenario shown in Figure 2, where spot BTC is trading at $100,000 and the CME BTC futures contract (nearing expiration) is trading at $101,000. The basis is $1,000 ($101,000 - $100,000). Annualized, that’s approximately 12.2% (1% × 365/30).
A trader could go long (buy) spot BTC via an ETF at $100,000 and simultaneously go short (sell) the CME BTC futures contract at $101,000 to lock in this $1,000 basis.
Assume at expiration both the spot BTC price and the futures price have converged to $105,000.
Spot Position: The ETF bought at $100,000 is now worth $105,000.
- Profit on spot = $5,000
Futures Position: The futures contract sold short at $101,000 must now be bought back (or settled) at the converged price of $105,000.
- Loss on futures = -$4,000 ($101,000 - $105,000)
Net Result: The $5,000 profit from the spot position is offset by the $4,000 loss on the futures position, resulting in a net profit of $1,000 ($5,000 - $4,000). This $1,000 is the original basis that was locked in (before considering any transaction fees or funding costs). The directional movement of BTC (from $100,000 to $105,000) did not change this predetermined profit from the basis.
Figure 2: Example Basis Trade (Source: CF Benchmarks)
The below example demonstrates how a trader would construct a leveraged basis trade using the spot Bitcoin ETF (ticker: IBIT) and the CME Bitcoin futures contracts.
Step 1: Establish the Core Spot Position
Purchase $100 million of a spot Bitcoin ETF outright. This is the "long" leg of the trade financed with equity capital.
Step 2: Add a Borrowed Overlay
Pledge the ETF shares as collateral with a prime broker. With a typical 25% haircut, the broker will lend up to 75% of the collateral's value. Against $200 million in ETF collateral (the $100 million equity-funded plus $100 million purchased with borrowings), the maximum lendable value is $150 million.¹
- Borrow $100 million to buy an additional $100 million of ETF shares.
- Borrow $50 million to meet the 25% initial margin requirement for short futures exposure.
This supports a $200 million short position in CME Bitcoin futures while maintaining $200 million long in ETF shares.
Resulting Exposures
- Long ETF: $200 million
- Short CME Futures: $200 million
- Loans Outstanding: $150 million
- Equity Invested: $100 million
The structure leaves you approximately delta-neutral while earning the basis.
Calculating the Annualized Return
Assumptions:
- Initial Capital (Equity): $100,000,000
- Short Futures Exposure: $200,000,000
- Loans Outstanding: $150,000,000
- Annualized Basis: 10%
- SOFR Rate: ~5.3%
- Borrowing Cost: SOFR + 2% = 7.3%
Calculation Steps:
- Gross Profit = Futures Notional Value × Monthly Basis Rate
$200,000,000 × 0.833% = $1,666,000
- Financing Cost = Loan Amount × Monthly Borrowing Cost
$150,000,000 × 0.608% = $912,000
- Net Profit = Gross Profit − Financing Cost
$1,666,000 − $912,000 = $754,000
- ROE (Monthly) = Net Profit ÷ Equity
$754,000 ÷ $100,000,000 = 0.754%
- Annualized ROE = (1 + ROE Monthly)¹² − 1
(1 + 0.754%)¹² − 1 = 9.43%
This represents a 9.43% annualized return on the initial $100 million equity investment, achieved through a delta-neutral position that isolates basis capture from directional Bitcoin price risk.
The Interplay of Spot Bitcoin ETFs and Futures Markets
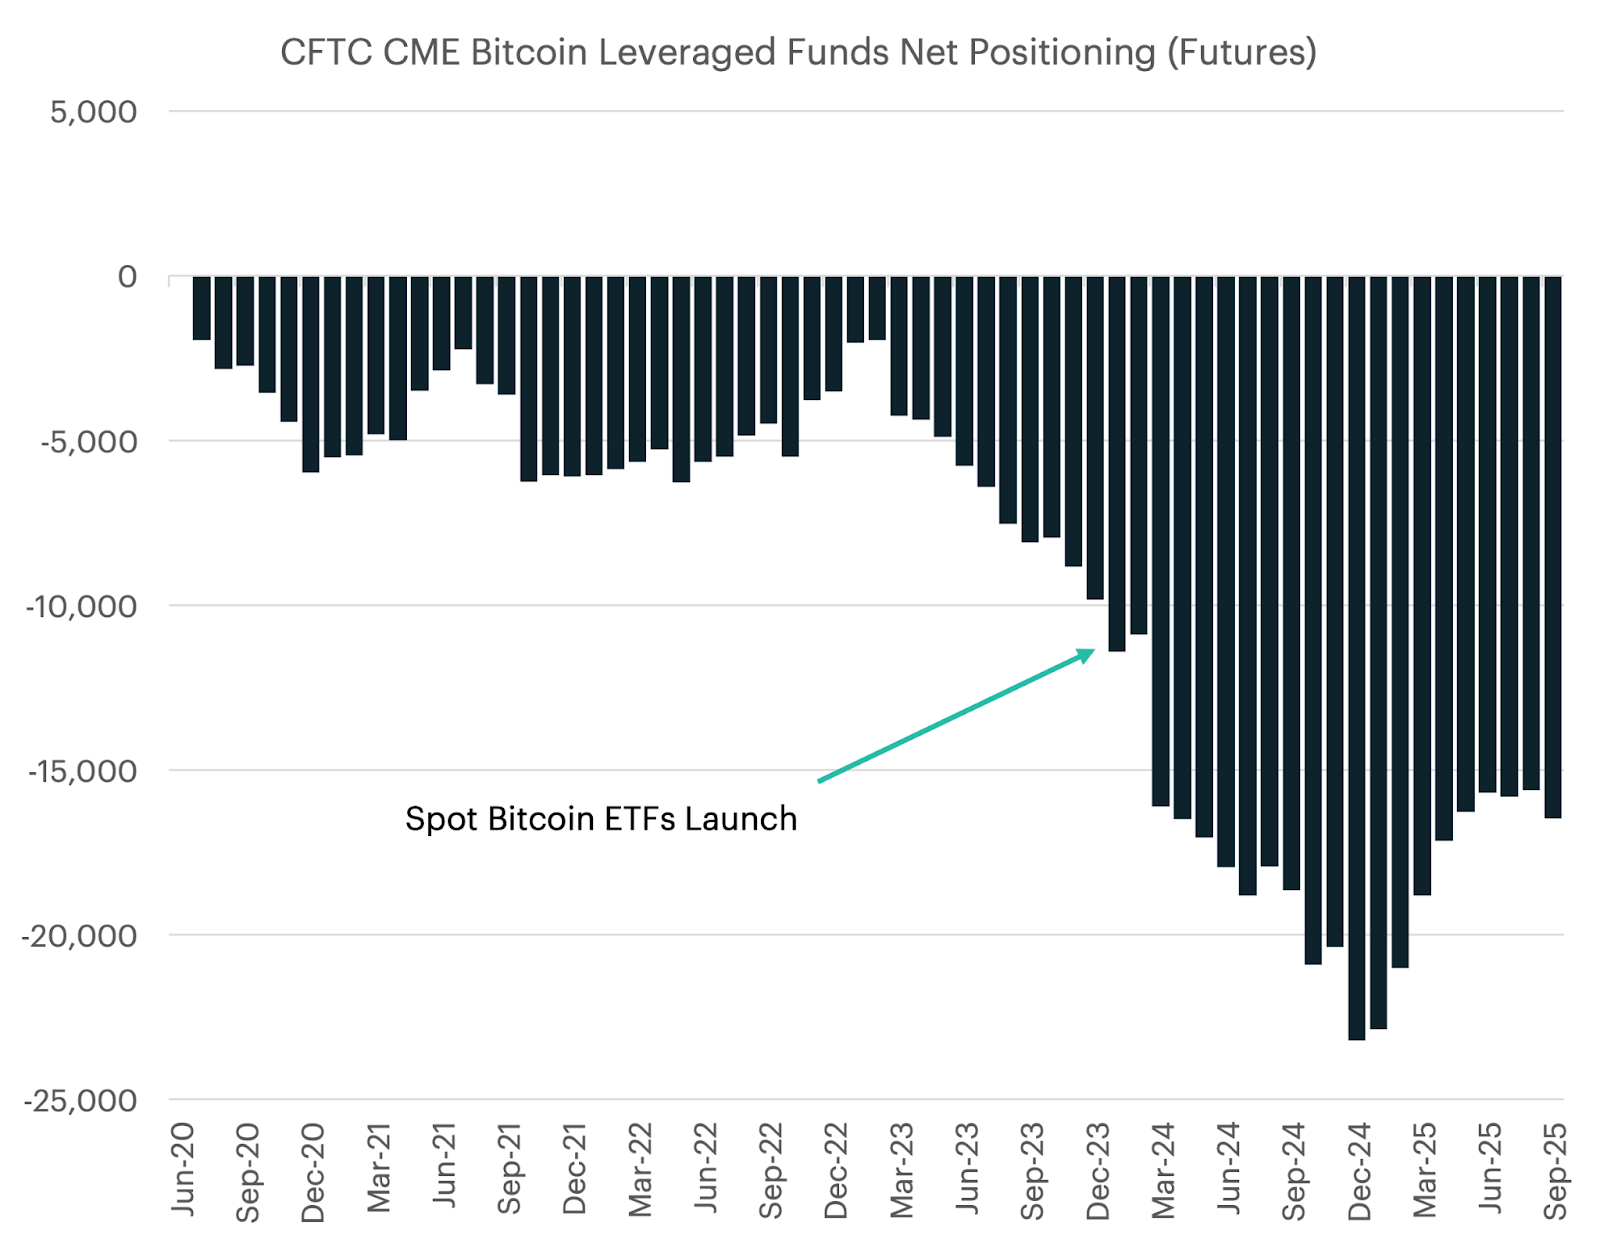
The launch of spot Bitcoin ETFs in the U.S. marked a significant shift in the futures landscape. The ETF structure has provided institutions with a regulated and liquid spot leg, making basis strategies more scalable. As shown in Figure 3, leveraged funds increased their net short positioning in CME Bitcoin futures following the ETF launch. This shift was not necessarily a directional bet against Bitcoin; rather, it reflected the growing use of basis trades, where futures are sold short to hedge long exposure in spot markets, including newly accessible ETF products. As ETF inflows grew, so did the associated short futures exposure, contributing to the deepening net short positions observed from late 2023 through 2025.
Figure 3: Levered Funds Net Positioning (Source: CF Benchmarks, Bloomberg as of 9/30/2025)
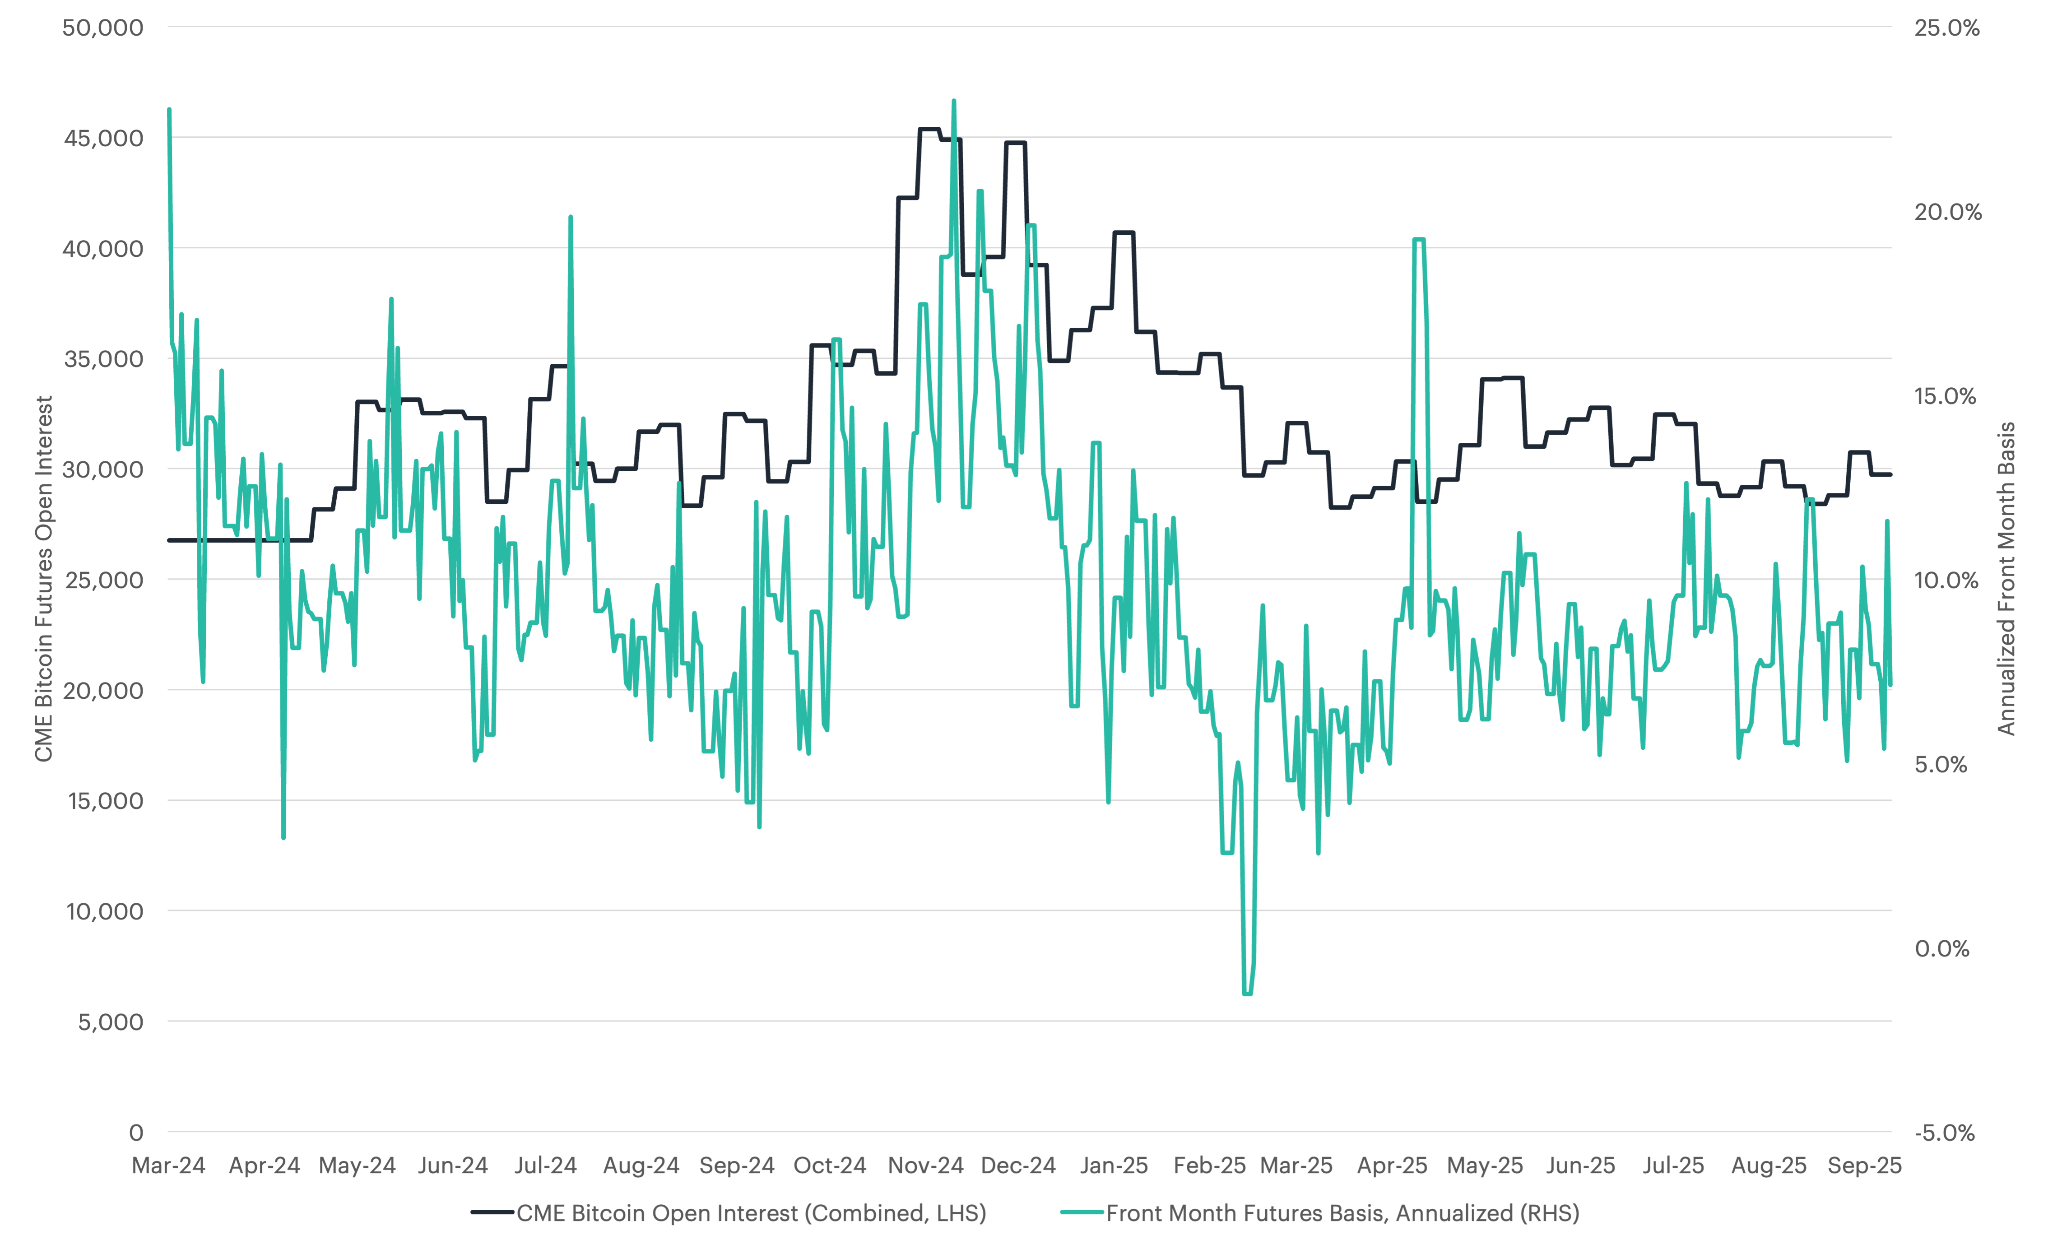
CME Bitcoin open interest (blue line) climbed from roughly 30,000 contracts in early January 2024 to a record near 45,000 in late November 2024 before easing back to the low 30,000s by May 2025. Each expansion in positioning coincided with a pronounced widening of the annualized front-month basis (green line). The basis approached 25% in February 2024 and exceeded 20% in November 2024, underscoring the premium investors were willing to pay for futures exposure during periods of strong bullish momentum. When market momentum reversed in March 2025, the basis briefly dipped below zero and open interest declined, reflecting a temporary phase of risk aversion and deleveraging. By May 2025, both series had leveled off, with open interest around 32,000 contracts and the basis near 10%, indicative of a more balanced, yet still positive, carry environment.
Figure 4: CME Open Interest and Front Month Basis (Source: CF Benchmarks, Bloomberg as of 9/30/2025)
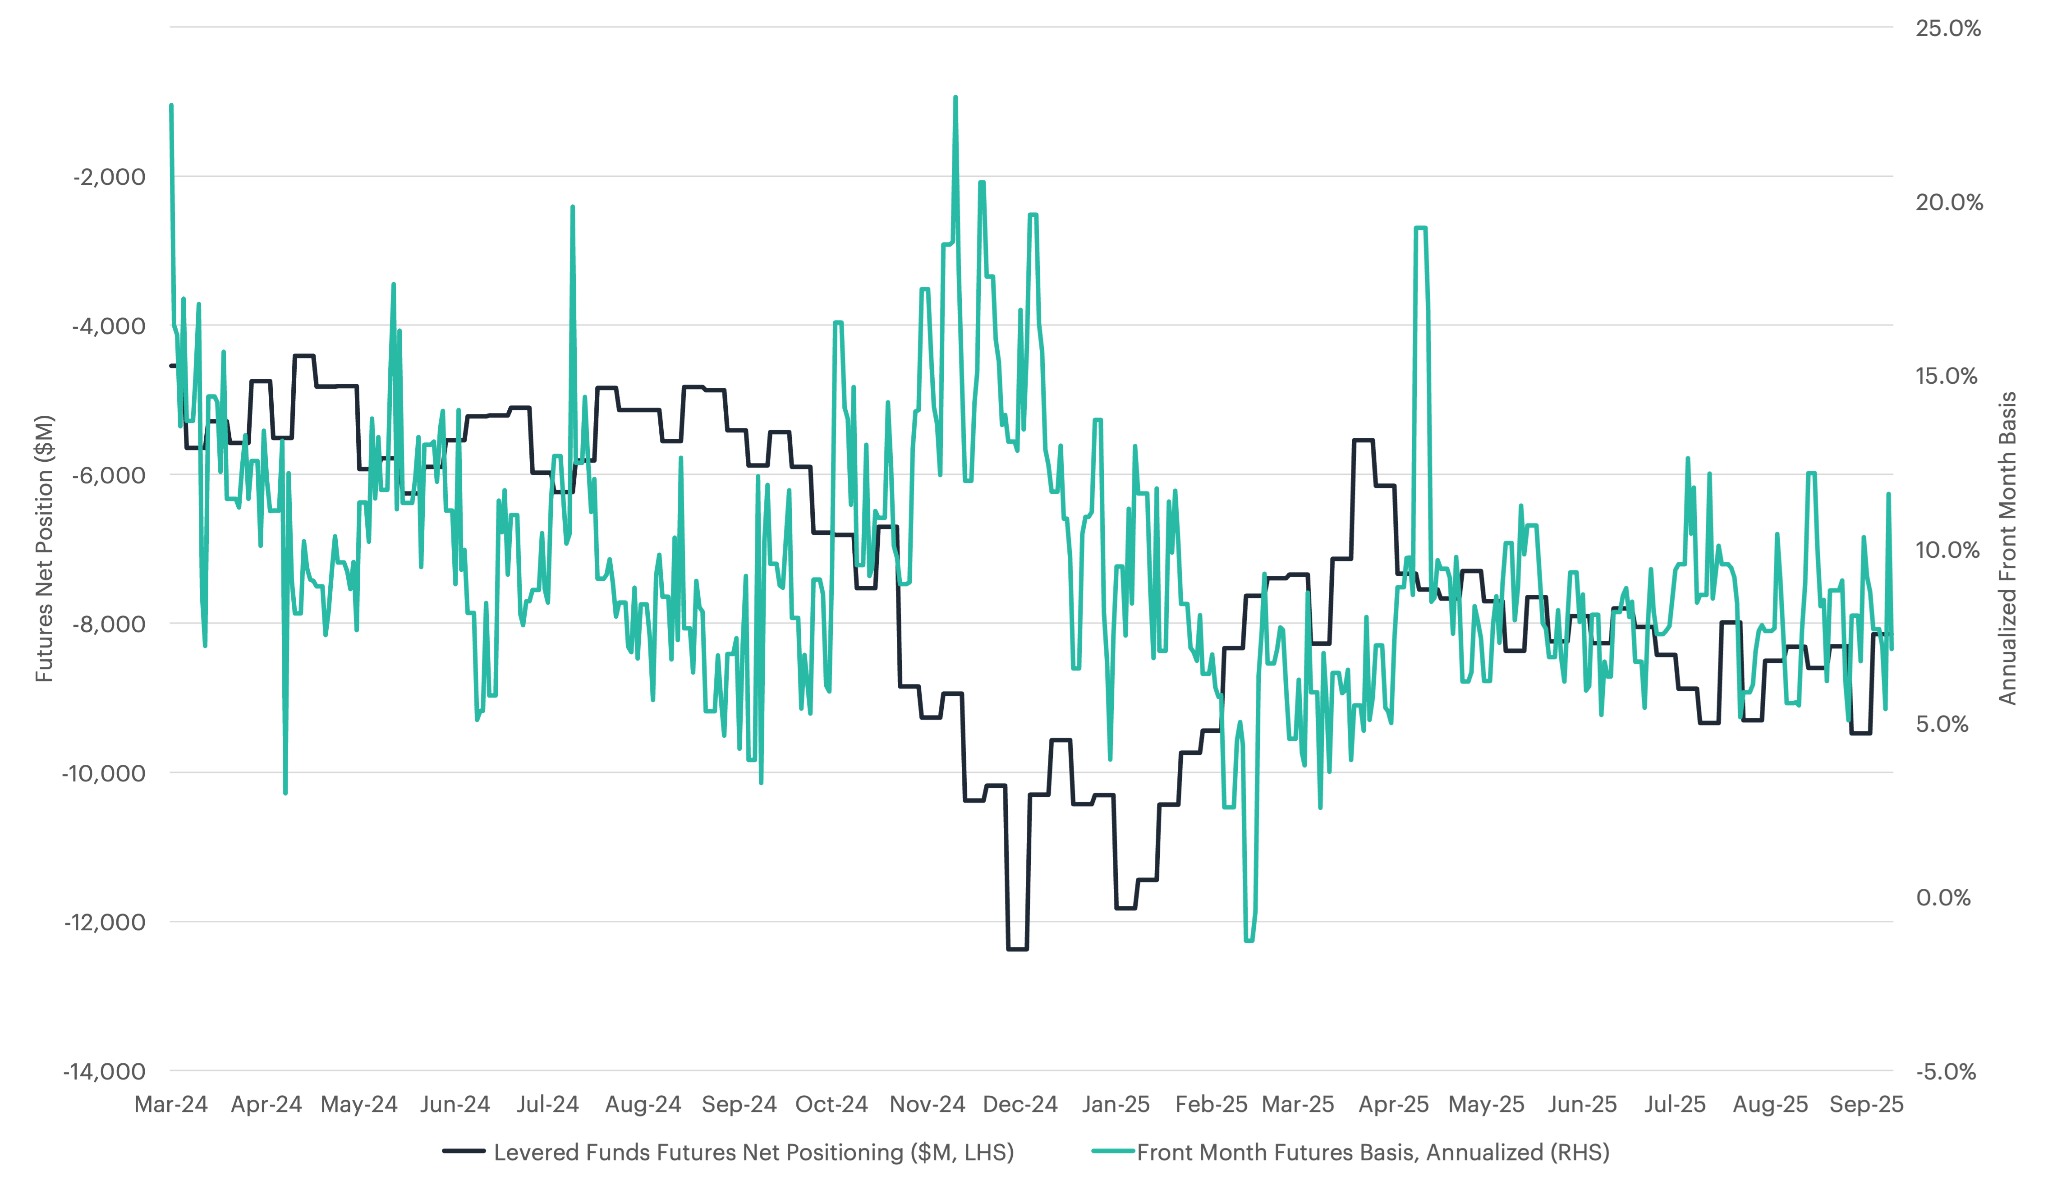
Building on the broader framework of momentum-based sentiment analysis, shifts in momentum signals can act as early indicators of basis turning points. A moderation in short-term momentum often precedes a narrowing of the basis within several trading days, while pronounced downside momentum typically aligns with deeper backwardation during bearish phases. Conversely, in April 2025, when trend strength faded and sentiment cooled, the basis compressed below 10%, and the futures market recorded nearly $1 billion in net long positions. This transition likely reflects the unwinding of basis trades initiated during the prior momentum-driven phase, as traders realized profits from the convergence of spot and futures prices.
Figure 5: Levered Funds Positioning and Front Month Basis (Source: CF Benchmarks, Bloomberg as of 9/30/2025)
The participation of institutional investors in basis trades contributes to improved market efficiency and liquidity. By actively trading on price discrepancies influenced by both momentum and sentiment, these entities help narrow the gap between spot and futures prices, promote more accurate price discovery, and reduce market fragmentation.
The Role of Price Singularity in Facilitating Arbitrage
Figure 6: CME CF Bitcoin Reference Rate Liquidity Complex (Source: CF Benchmarks)
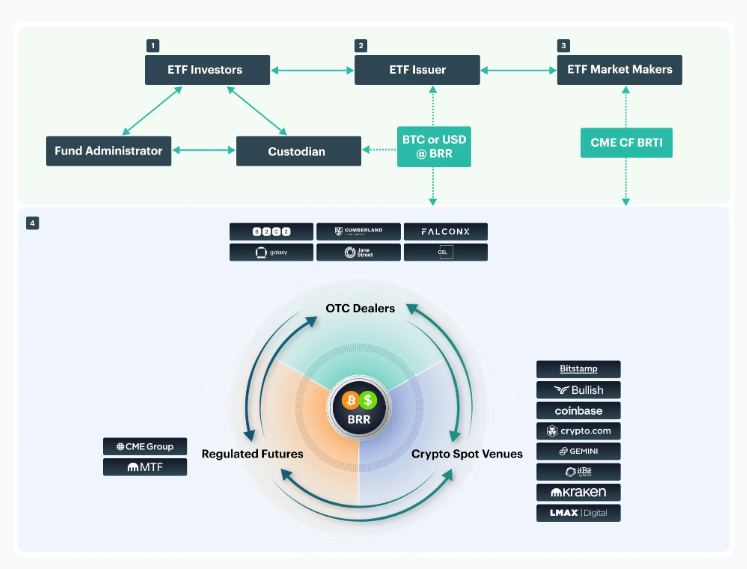
The alignment of price benchmarks between spot Bitcoin ETFs and CME futures contracts plays a crucial role in enabling precise momentum- and sentiment-based arbitrage opportunities. Six of the spot Bitcoin ETFs utilize the CME CF Bitcoin Reference Rate – New York Variant (BRRNY) to determine the Net Asset Value (NAV) for creation and redemption. Simultaneously, CME futures contracts settle using the same reference rate. This synchronization ensures that both instruments are inherently linked to the same price benchmark, facilitating more efficient basis trades during momentum and sentiment cycles.
The CME CF BRR ties the spot markets to the regulated futures markets, creating a powerful liquidity complex that ETF issuers can rely on to ensure orderly creations and redemptions of ETF shares. Managers can buy and sell Bitcoin through major OTC dealers at the CME CF BRR with abundant liquidity, ensuring perfect tracking and eliminating NAV drift.
The establishment of robust and replicable price benchmarks enhances market transparency while allowing sentiment-driven inefficiencies to persist long enough for arbitrage. This creates an optimal environment where price singularity reduces execution risk while behavioral factors continue driving profitable basis opportunities.
Breaking Down the Drivers of Crypto Basis
Several structural features set the cryptocurrency basis apart from its traditional-asset analogue and amplify the influence of momentum and sentiment. Participation is one key distinction: while traditional equity and commodity markets are dominated by institutions, crypto remains far more retail-driven. SPY, for instance, has 57.6% institutional ownership according to recent 13F filings, whereas the IBIT spot Bitcoin ETF has only 27.5%. This larger retail footprint makes flows more volatile and sentiment swings more pronounced. Episodes of FOMO in bull phases and capitulation during drawdowns push the basis around far more sharply than in institution-heavy markets.
A second defining feature is that the market never closes. Blockchains and associated spot venues operate 24/7/365, and unlike companies reporting earnings quarterly, crypto networks continuously publish on-chain data in real time. Prices respond instantly, and shocks propagate across regions with no natural reset period. This nonstop flow of information causes crowd psychology to compound rather than reset, creating uninterrupted arbitrage windows and accelerating feedback loops that directly shape basis behavior.
Perpetual futures add another dimension. Unlike conventional futures with fixed expiries, perpetual contracts have no maturity date. Exchanges keep them anchored to spot through periodic funding payments—typically every eight hours—that balance long and short positioning. When demand to be long dominates, perpetuals trade at a premium and longs pay shorts; when shorts dominate, the reverse occurs. This structure embeds sentiment directly into the cost of carry. Whereas traditional futures markets reveal bias indirectly through term structure, in crypto it is visible in real time and immediately reflected in P&L.
The velocity of information flow in crypto further amplifies these effects. Tweets, Reddit threads, or breaking news can move the basis within hours, while comparable sentiment in equities or commodities may take days to filter through analysts and institutions. The combination of nonstop trading, transparent data, and high retail participation creates shorter, sharper, and self-reinforcing feedback loops. Together, these mechanics produce a basis continuously reshaped by the interplay of positioning, funding, and real-time sentiment momentum.
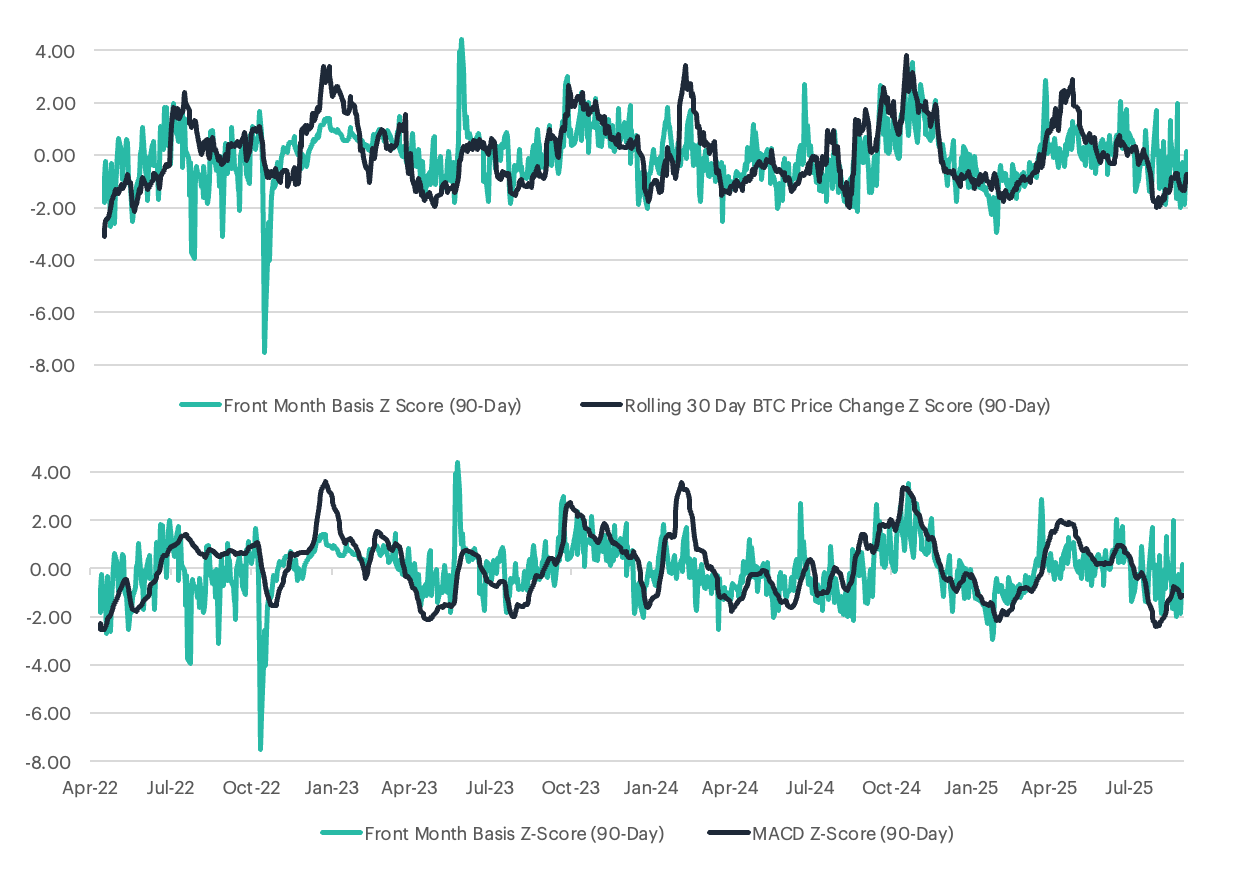
Unlike traditional commodities, where the basis reflects storage, financing, and transportation costs as well as convenience yields, Bitcoin’s basis is primarily driven by price momentum and sentiment dynamics. We proxy Bitcoin’s momentum using two standardized measures: the Z-score of the MACD line, capturing short-term trend intensity, and the 90-day Z-score of the rolling 30-day return, reflecting medium-term relative strength. As detailed in Appendices A and B, these indicators show strong correlations of 0.50 and 0.54, respectively, with the CME Bitcoin futures basis (see Appendix C), underscoring their explanatory power in capturing the behavioral drivers of crypto basis formation.
Figure 7: Momentum and Basis (Source: CF Benchmarks, Bloomberg as of 9/30/2025)
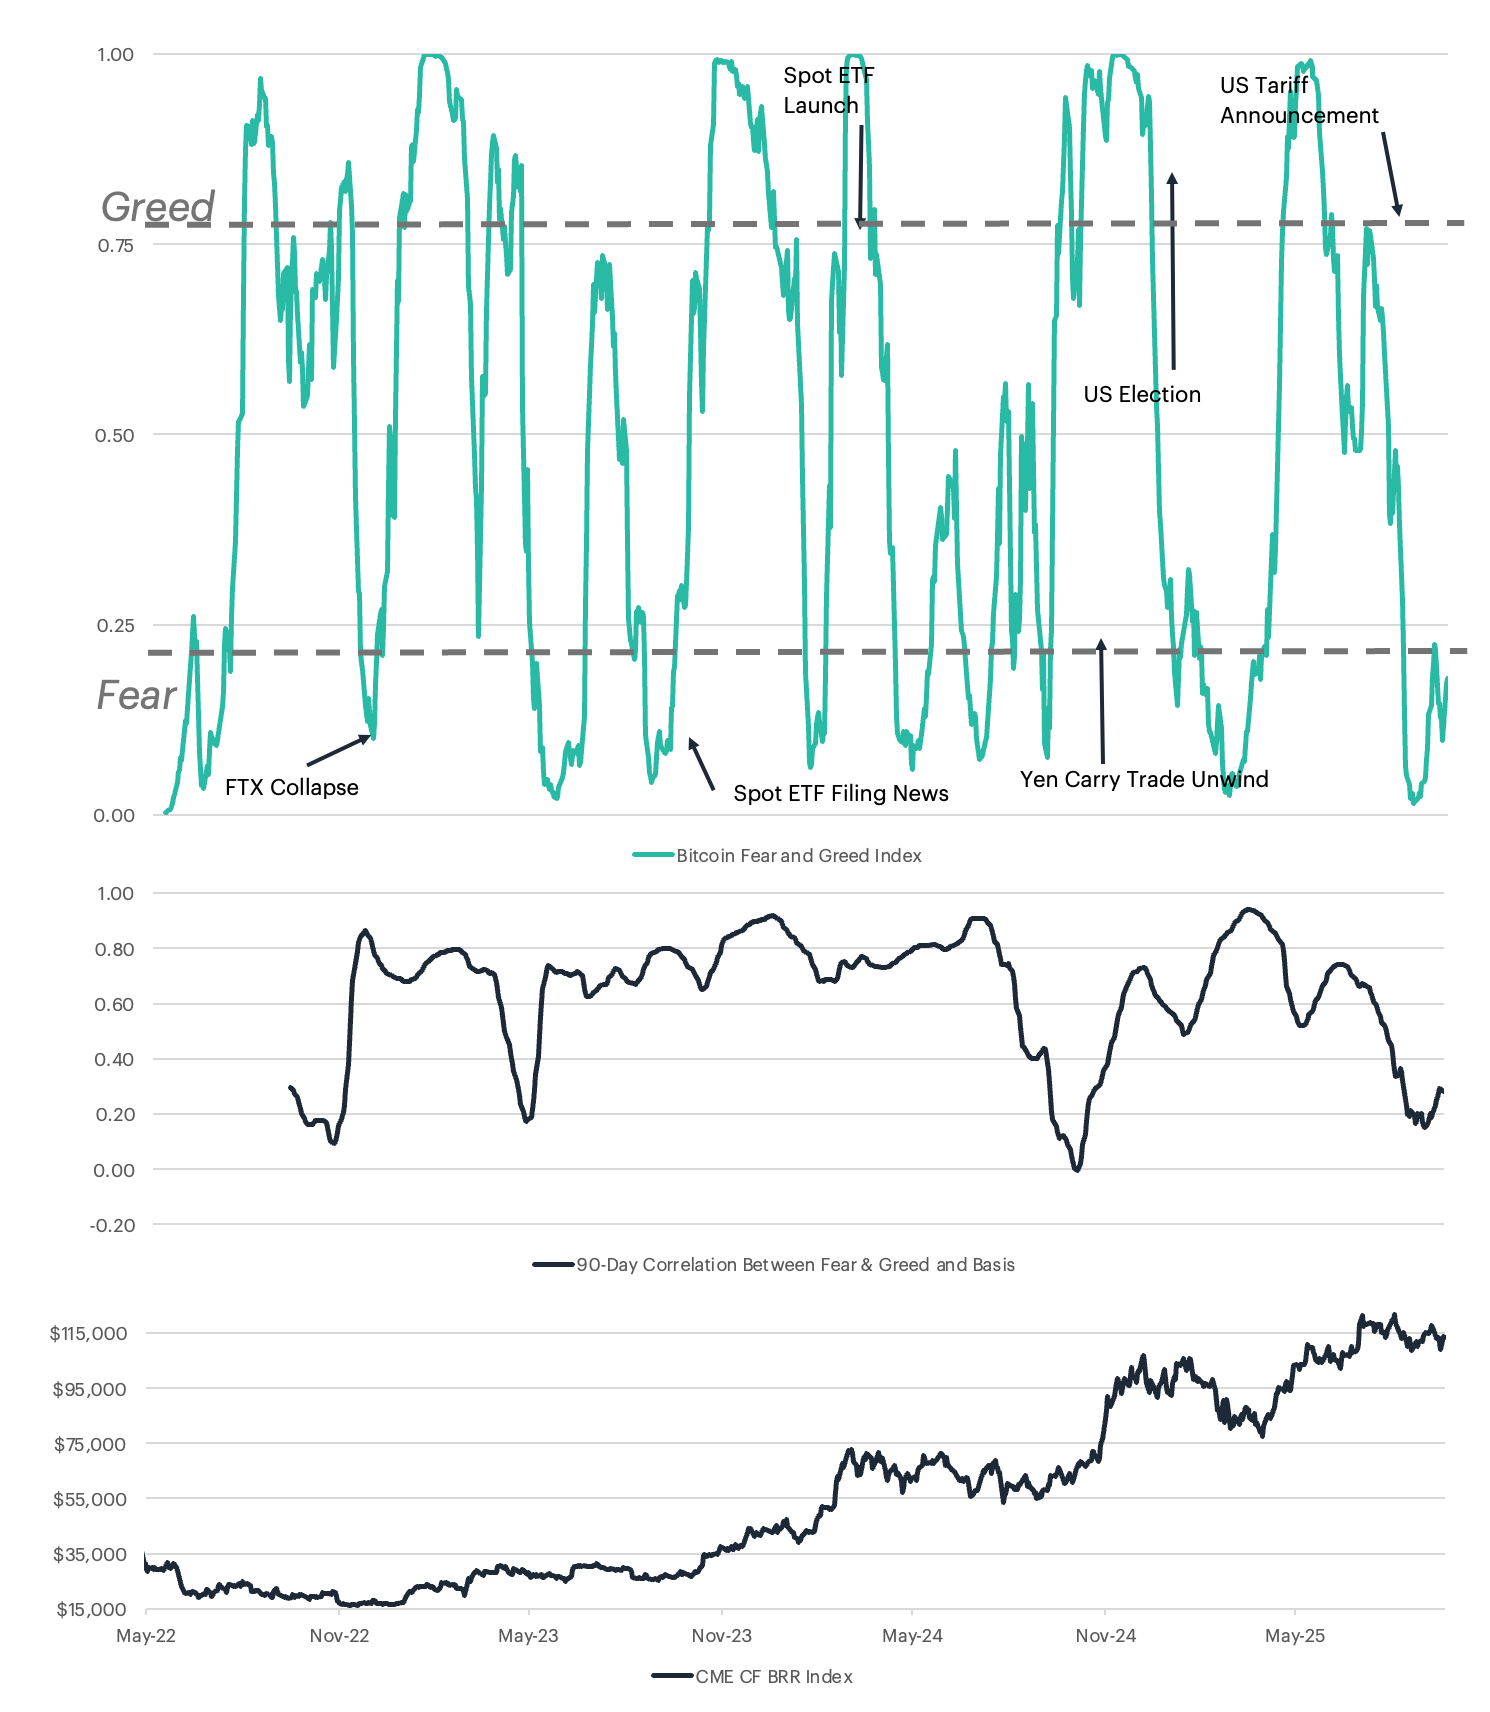
To translate these momentum readings into a single, intuitive measure of market psychology, we combine them into a Bitcoin Fear & Greed Index. This index averages the 90-day Z-scores of the MACD line and the 30-day rolling return to create a composite standardized momentum measure. The composite score is then passed through the standard normal cumulative distribution function (CDF), which converts it to a smooth 0-to-1 scale—values near 0 denote extreme fear, while values near 1 denote extreme greed.
When Bitcoin’s price accelerates and sentiment tilts toward greed, the CME Bitcoin basis consistently turns positive (Figure 8). This behavior reflects how momentum-driven demand, amplified by bullish sentiment, leads traders to bid up futures contracts, resulting in sustained premiums during euphoric market phases. Conversely, during periods of negative momentum or sharp price declines accompanied by fear, the basis turns negative or contracts significantly. These patterns illustrate the behavioral feedback loop between sentiment and derivatives pricing.
Market sentiment operates as both a driver and amplifier of momentum effects. During periods of extreme greed, defined as Fear & Greed Index values above 0.75, basis patterns become more pronounced, with contango premiums often reaching 15–30% annualized. In contrast, extreme fear, when the index falls below 0.25, is associated with sustained backwardation that can persist for weeks or months. The charts in Figure 3 illustrate this relationship clearly. During Bitcoin’s early 2024 rally, particularly around the spot ETF launch, the Fear & Greed Index remained elevated in “extreme greed” territory for an extended period, and futures premiums widened sharply as traders expressed bullish momentum through derivatives. A similar dynamic emerged following the U.S. election in late 2024, when optimism kept the index near peak greed levels, driving annualized futures premiums to 15–20%. These sentiment-driven dislocations demonstrate how greed cycles frequently coincide with overheated derivative markets and expanded basis spreads.
Figure 8: Bitcoin Fear and Greed Index (Source: CF Benchmarks, Bloomberg as of 9/30/2025)
Professional traders may integrate technical indicators such as the MACD into basis trading frameworks to refine timing precision. As shown in Figure 4, combining MACD Z-scores with traditional basis signals provides a more nuanced view of market momentum shifts and potential dislocations. This approach enhances the ability to anticipate turning points while maintaining the delta-neutral structure that isolates alpha from broader market direction. Figure 4 also highlights the strong relationship between Bitcoin’s front-month futures basis (90-day Z-score) and its rolling 30-day price change (also shown as a 90-day Z-score). The persistent alignment between these metrics underscores how price momentum serves as a practical proxy for market sentiment, revealing shifts in investor positioning and conviction.
During sustained uptrends, bullish sentiment drives spot prices higher and widens the basis, prompting leveraged traders to short front-month futures and go long spot to capture elevated premiums. The reverse occurs during negative momentum phases, when traders short spot and buy futures to exploit discounts. These dynamics reinforce the importance of momentum-based indicators such as the MACD Z-score in identifying favorable entry points, improving hedging precision, and enhancing the consistency of risk-adjusted returns. A sentiment-informed, delta-neutral framework enables market participants to extract value from structural dislocations in futures pricing without relying on outright directional exposure.
In Figure 9, we analyze the impact of adding both a simple basis overlay and a leveraged overlay to a spot Bitcoin allocation. The backtest highlights how selectively harvesting basis premiums and gating exposure with sentiment signals can materially enhance both returns and risk-adjusted outcomes while introducing only marginal additional volatility.
Figure 9: Basis Arbitrage Backtest (Source: CF Benchmarks, Bloomberg as of 9/30/2025)
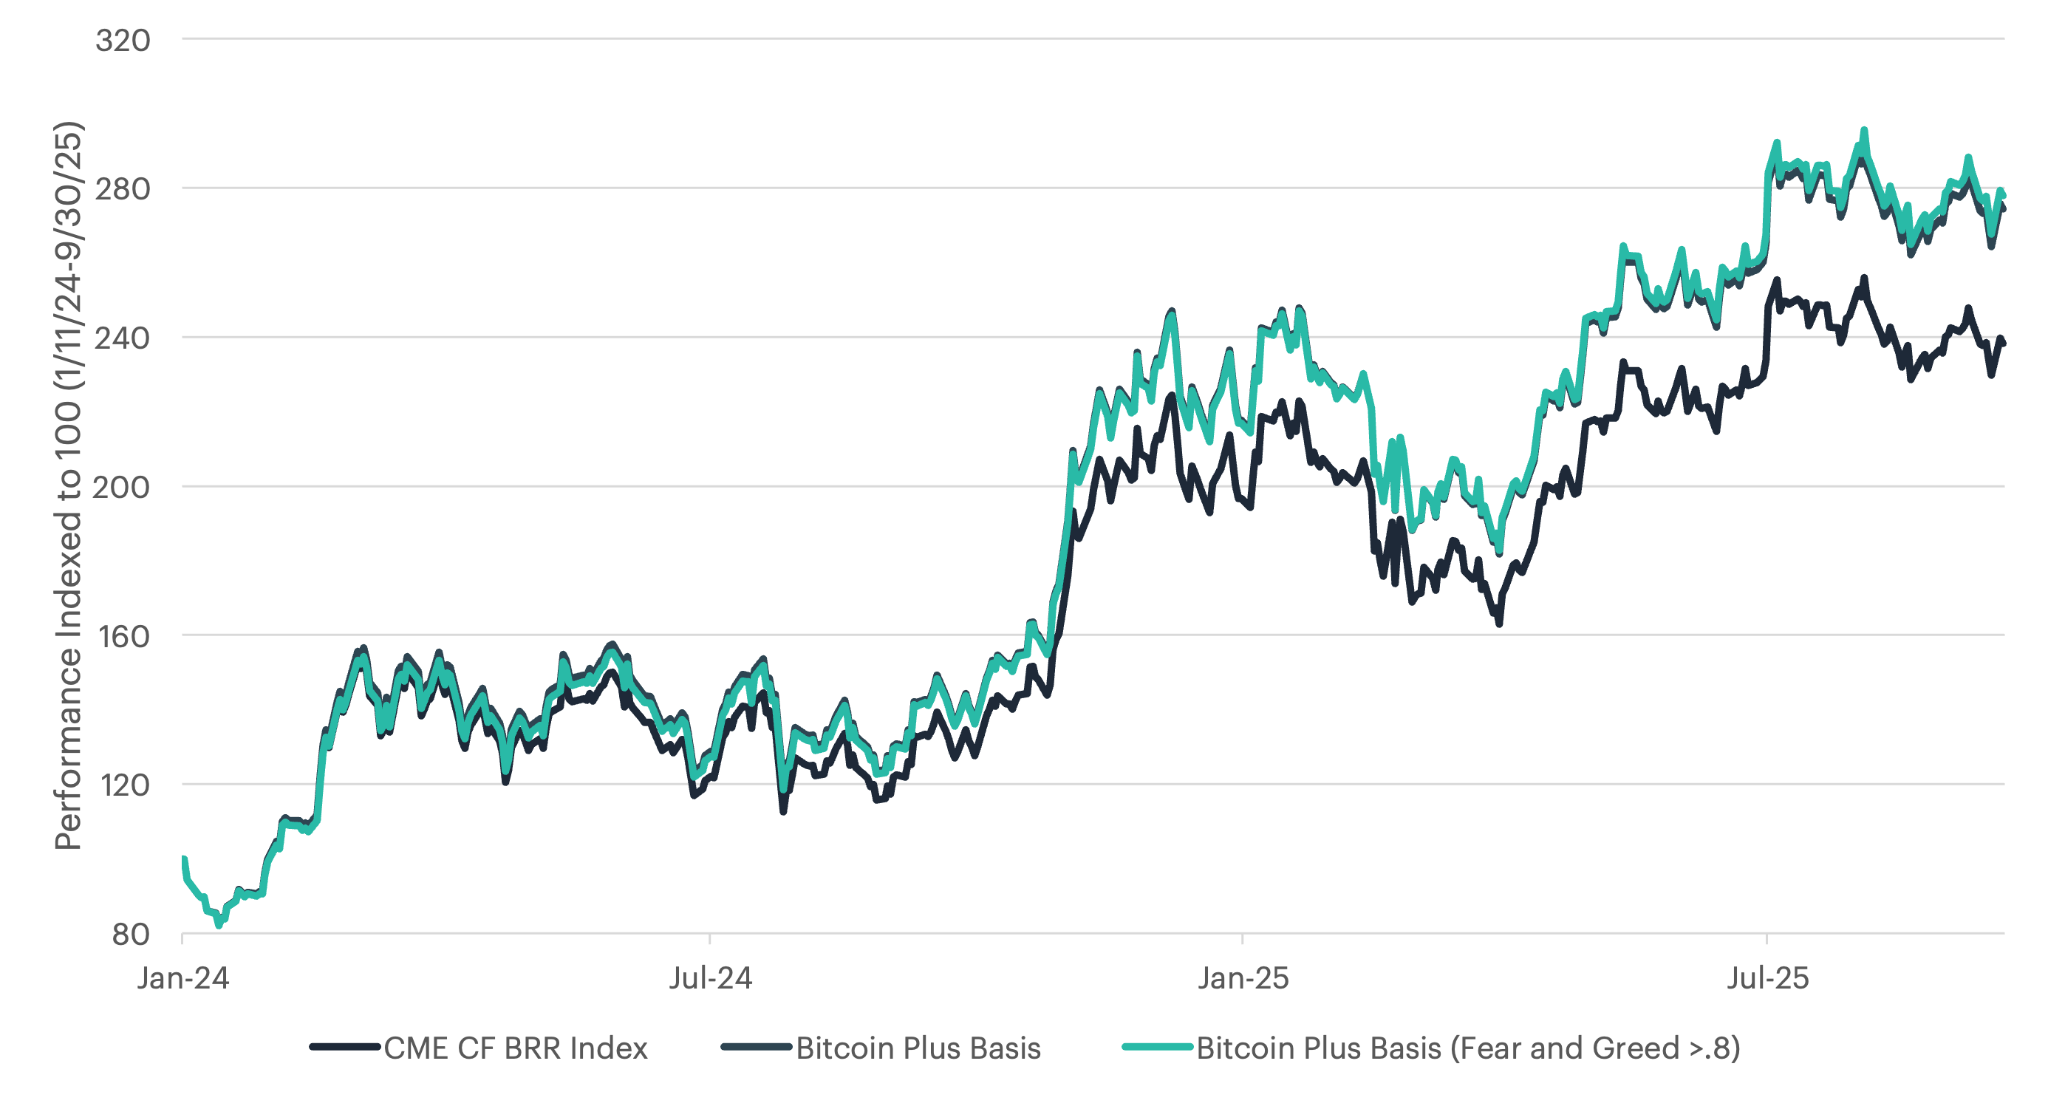
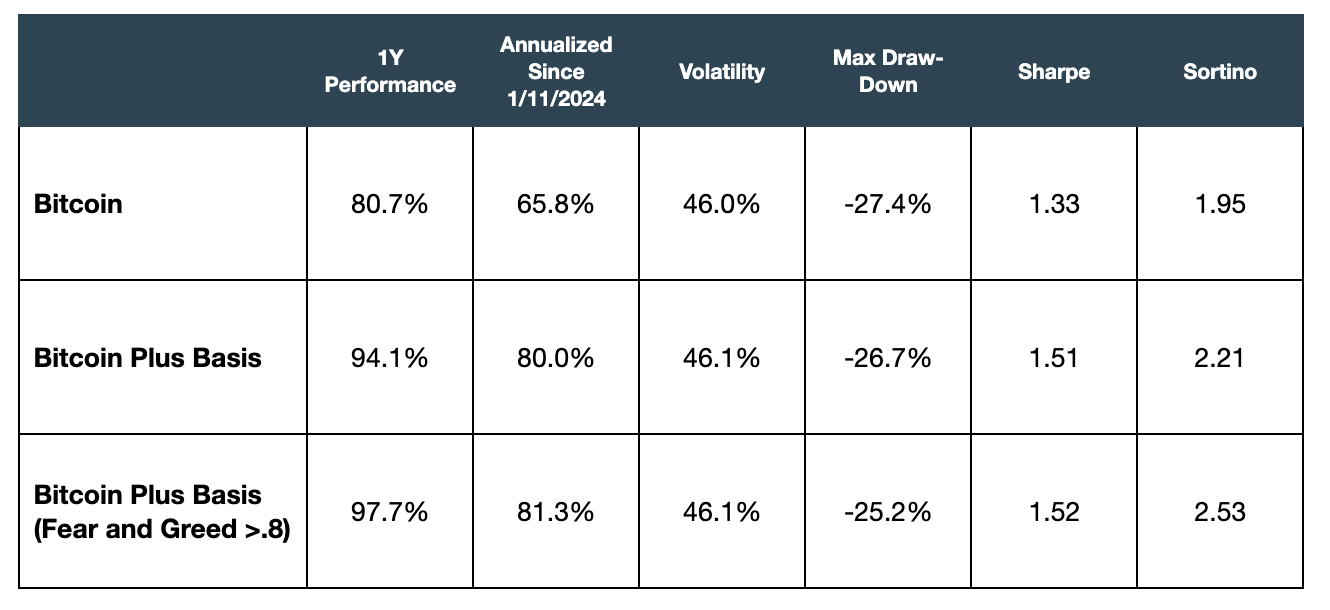
Adding a basis overlay has clearly added incremental alpha to a pure spot Bitcoin allocation. The spot-only sleeve returned 80.7% with a 1.33 Sharpe ratio over the last twelve months, but simply harvesting the basis whenever it exceeded SOFR by 300 bps lifted performance to 94.1% and pushed the Sharpe to 1.51, with virtually no extra volatility (46.1% p.a.) and a slightly reduced maximum drawdown. Applying the overlay only when the Fear & Greed Index exceeds 0.8 and closing the position when it falls below 0.2 further increased the return over the last year (94.1%) and beat spot on both absolute and risk-adjusted terms (Sharpe 1.52 vs. 1.33). Crucially, the filter demonstrates that a simple sentiment-momentum signal can keep most of the upside while sidestepping periods when the basis is positive but there may be more attractive opportunities elsewhere in the market.
Over the full sample, the sentiment-gated approach (enter when Fear & Greed > 0.8; exit < 0.2) also delivers a higher annualized return since inception than the always-on strategy, with comparable—or better—risk-adjusted performance. This doesn’t overturn the early-sample dynamic: the opening stretch, marked by persistently elevated basis and strong momentum/“greed,” still favored staying fully invested. But as volatility moderated and basis expansions became less persistent, the tactical filter captured more of the upside while avoiding lower-quality carry, producing the higher all-time return in the updated figures.
Implications for Market Liquidity and The Durability of the Basis
As more institutional investors engage in momentum- and sentiment-based basis trades, the liquidity landscape continues evolving. Open interest on Bitcoin futures has surged as much as 83% since the spot Bitcoin ETF launches, with significant volume concentration at the short end during high-sentiment periods. This suggests traders actively arbitrage sentiment-driven basis patterns at shorter maturities, capitalizing on rapid sentiment-price convergence cycles.
Sentiment-driven basis trading has created a self-reinforcing ecosystem where institutional understanding of behavioral patterns leads to increased participation, which paradoxically strengthens the predictability of sentiment-basis relationships. This dynamic supports continued market growth while maintaining the fundamental psychological characteristics that make basis trading profitable. The integration of sentiment analysis into basis trading has improved price discovery efficiency during extreme market conditions. When sentiment reaches extremes, basis patterns provide early warning signals for potential reversals, helping markets process information more effectively than traditional fundamental analysis alone.
Several strands of evidence point to a durable, and possibly strengthening, momentum- and sentiment-driven bias in the Bitcoin basis. Behavioral forces show no sign of abating: the same feedback loop of social media amplification, retail FOMO, and institutional pattern-seeking that fueled past cycles is poised to expand as digital asset adoption deepens. Institutional desks are embedding sentiment directly into their basis models, pairing traditional carry logic with natural-language signals that flag potential dislocations. The result is a virtuous circle of deeper liquidity and more frequent basis opportunities, even as those desks arbitrage the very behavior they measure.
Technology is pushing the edge further. Advances in real-time sentiment scraping and large-language-model analytics now let quants parse millions of tweets, news headlines, and on-chain chats in milliseconds, rewarding those who can price sentiment faster and more precisely than the competition. At the same time, the playbook is migrating beyond Bitcoin; the advent of spot Ether ETFs and other regulated products is spawning cross-asset trades that exploit correlated swings in sentiment across multiple tokens. Taken together, these forces suggest the sentiment-driven basis is not a transient quirk but a structural feature that is likely to persist as market breadth widens.
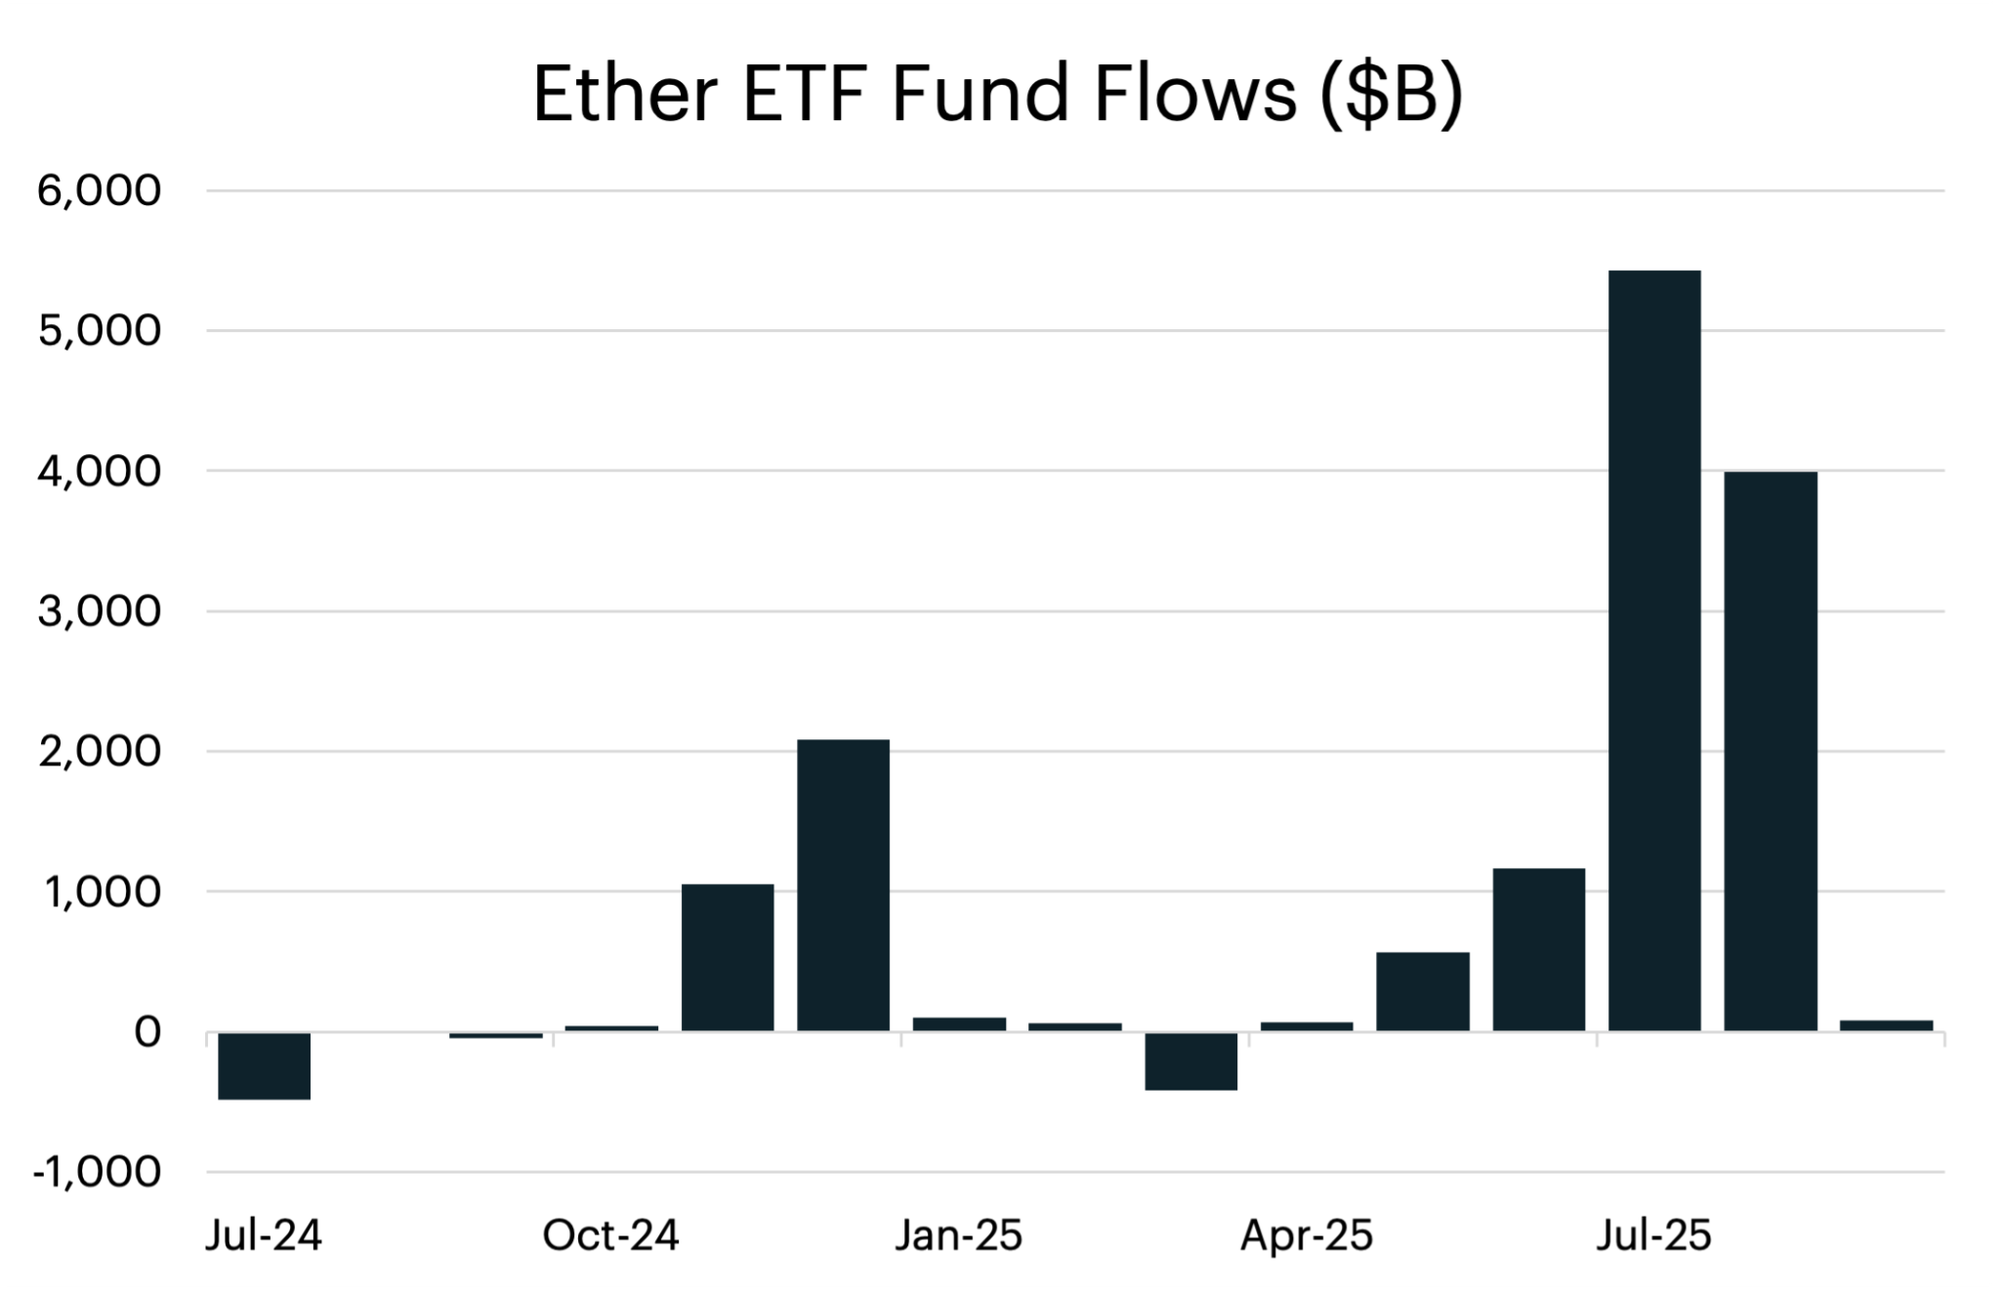
In Q2 2025, the Ether basis expanded north of 10% on multiple occasions, and we saw activity in both the spot ETF market and the futures market consistent with basis trading. Between April 2025 and August 2025, the net positioning by leveraged funds decreased from -6,000 contracts to -19,200. This coincided with roughly $11.2 billion in flows into spot Ether products over the same time period.
Figure 10: Ether Net Positioning (Source: CF Benchmarks, Bloomberg as of 9/30/2025)
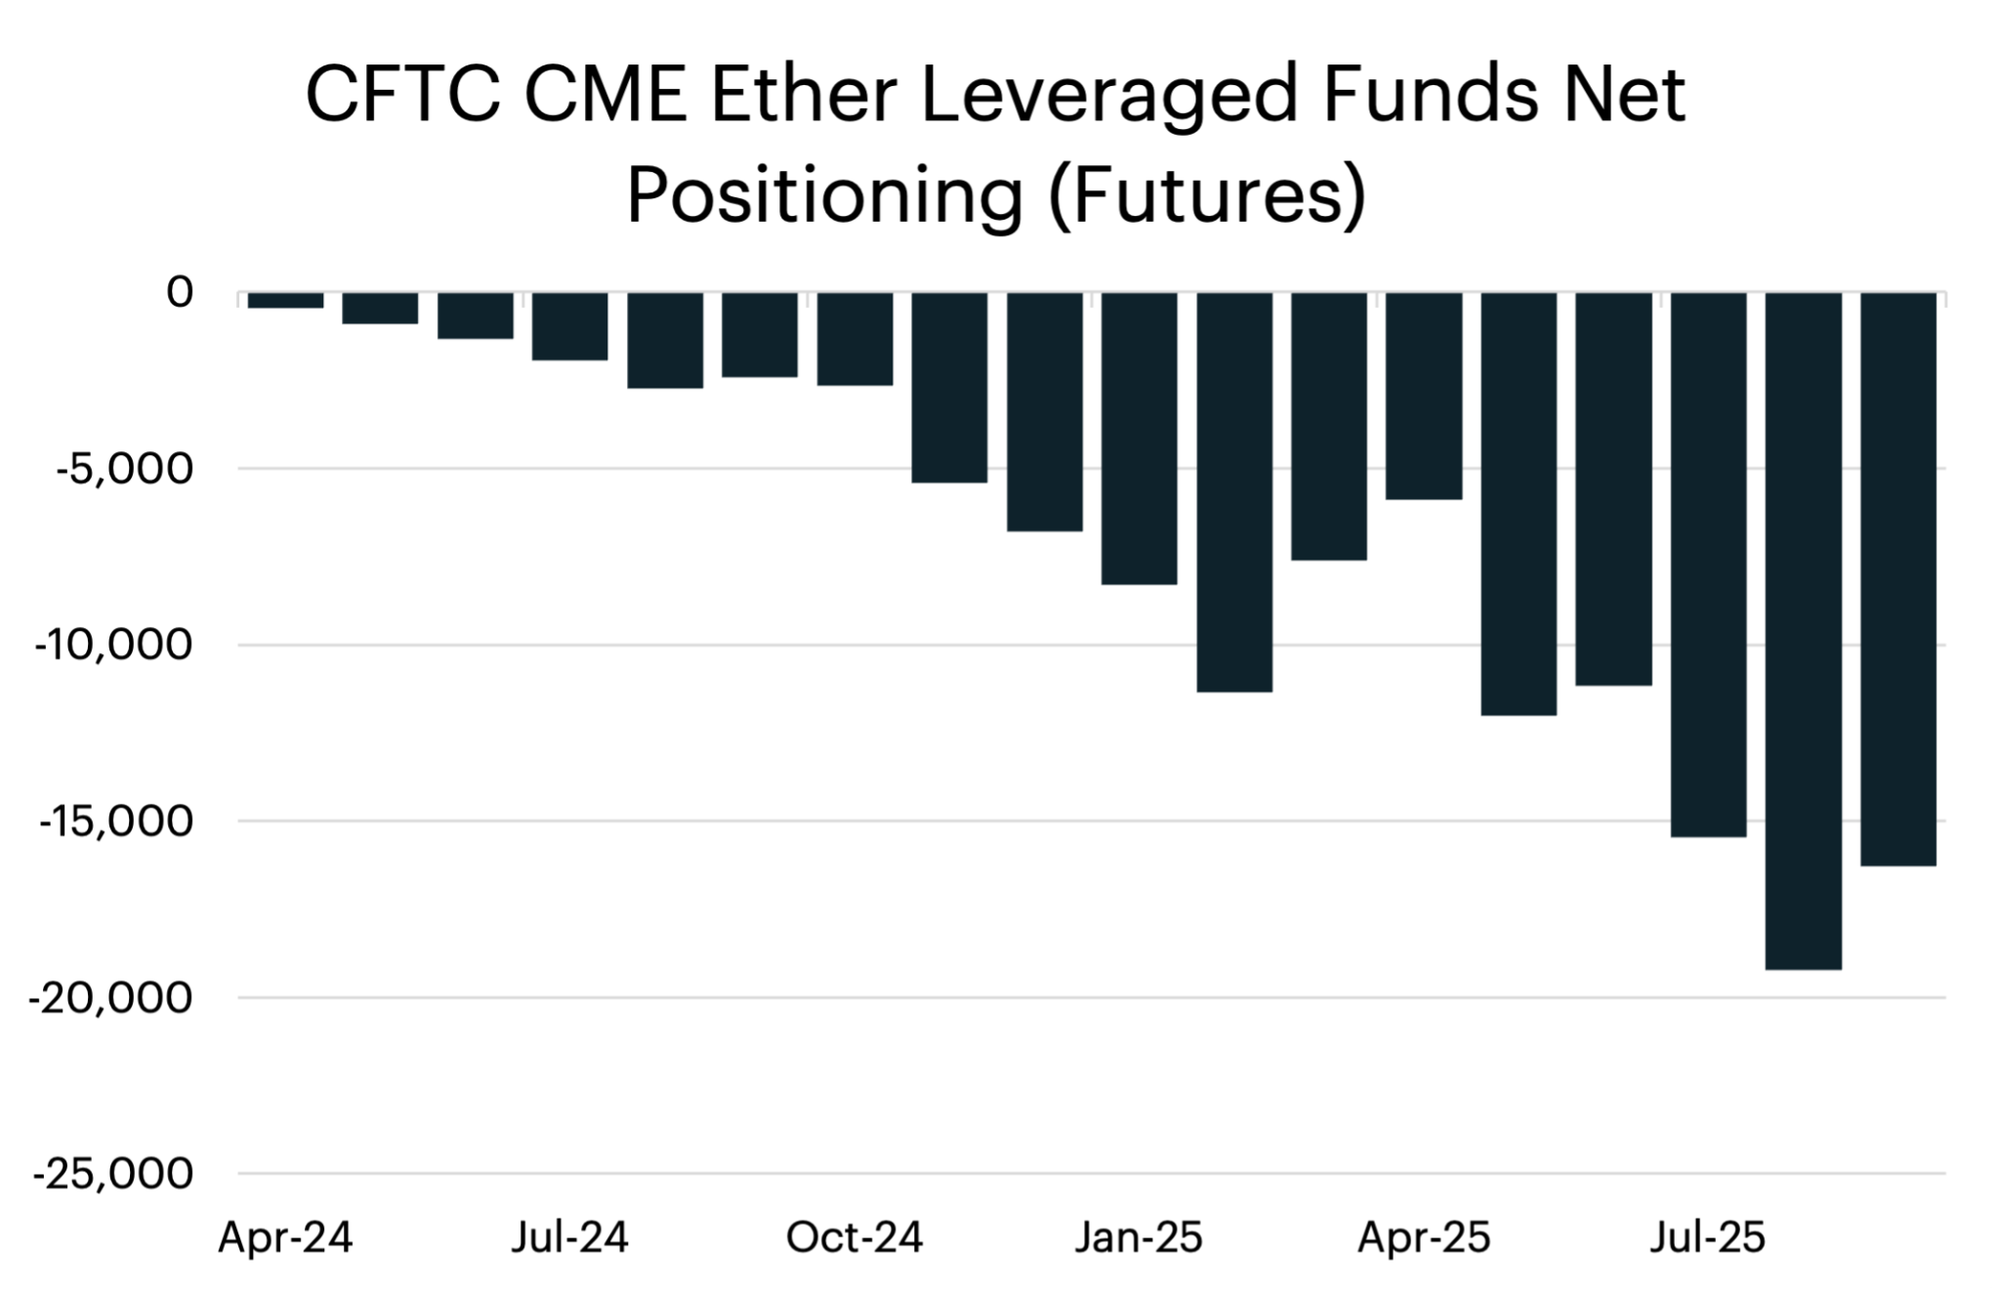
Figure 11: Ether Front Month Basis (Source: CF Benchmarks as of 9/30/2025)
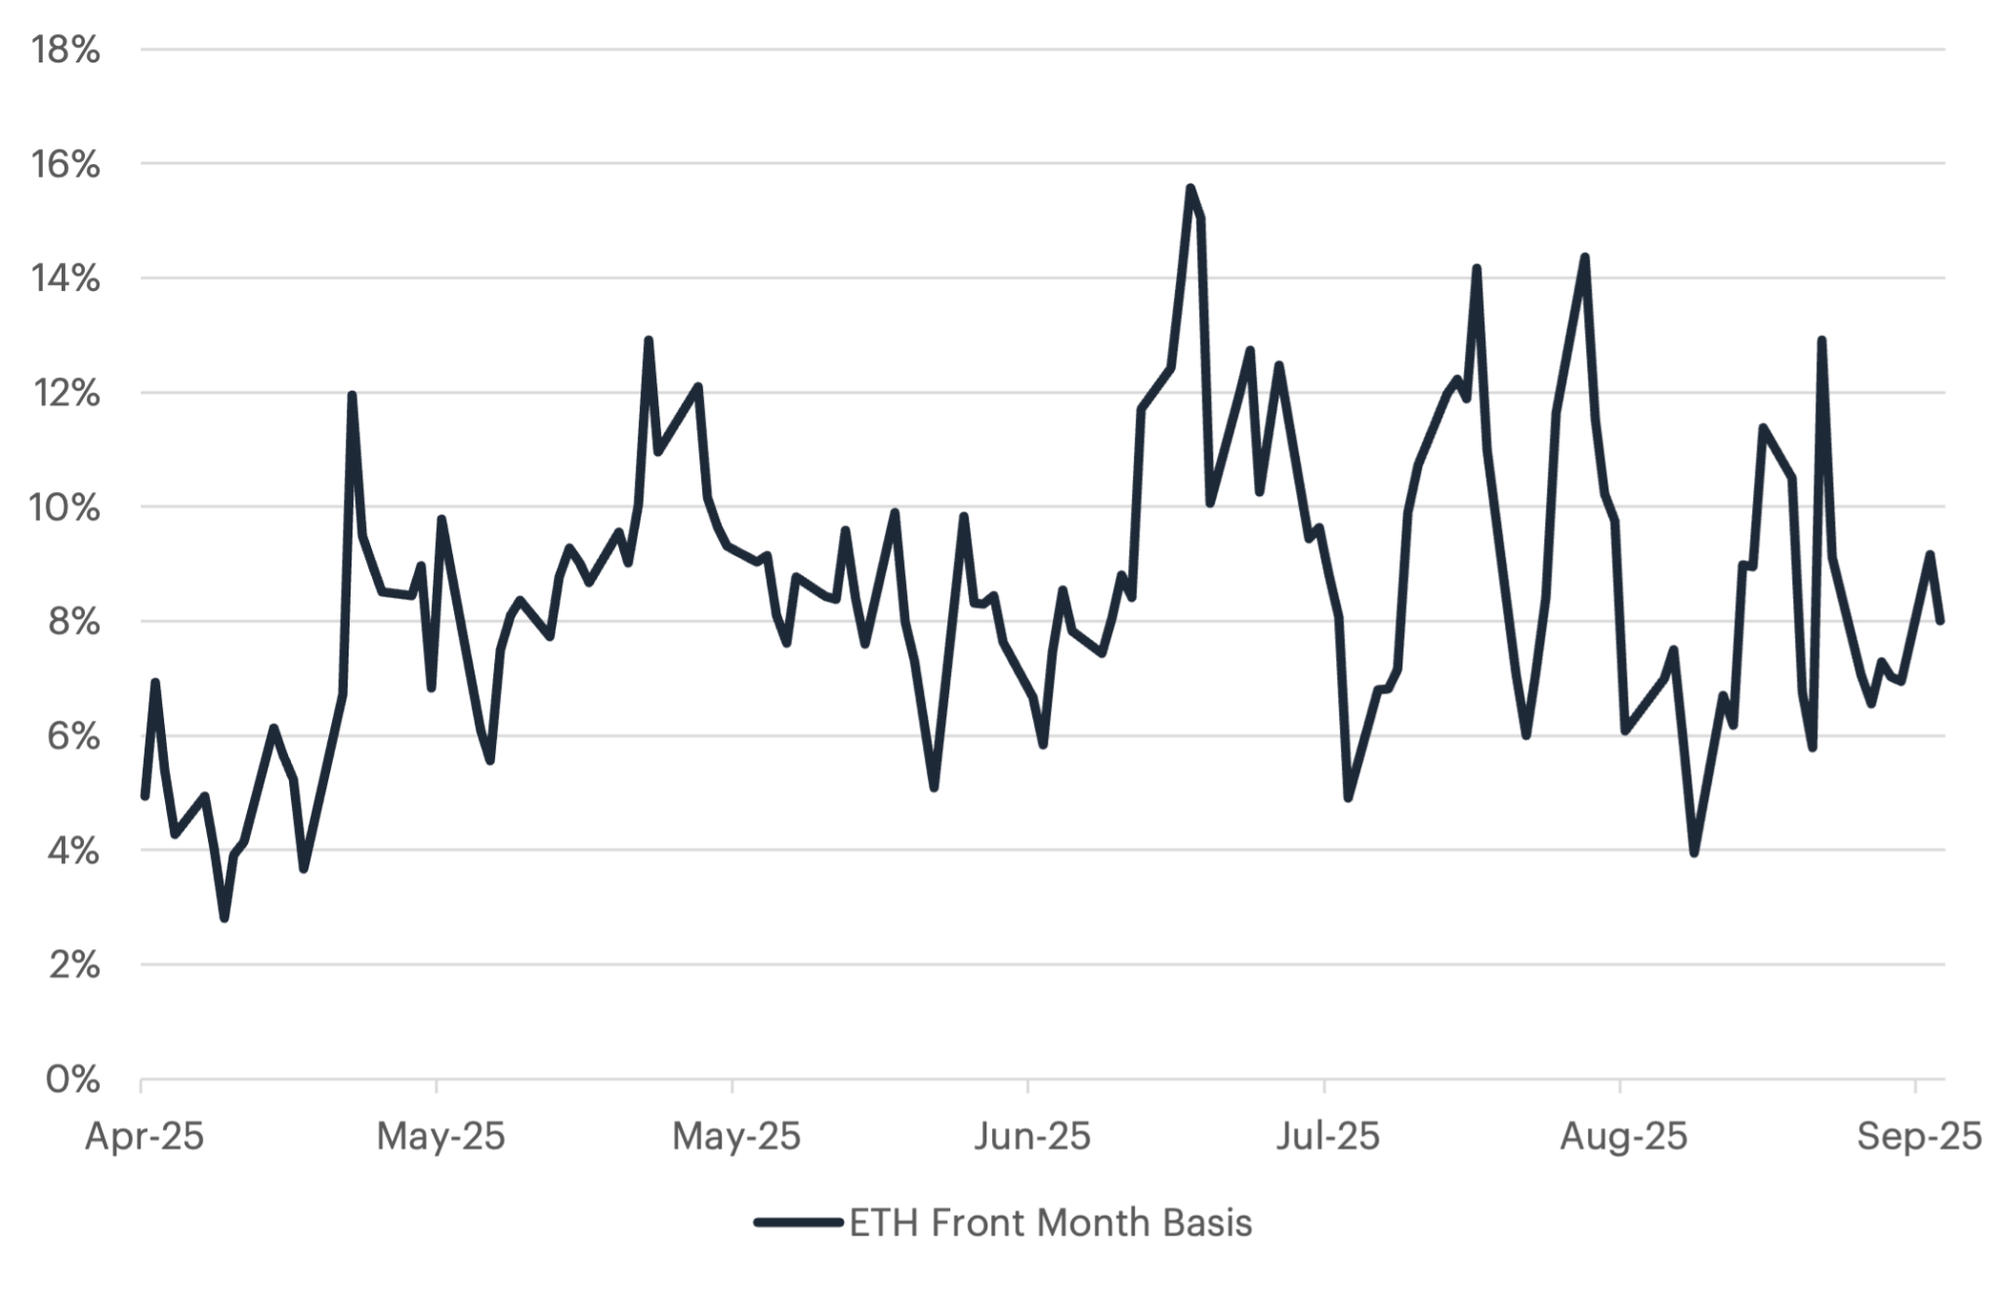
Figure 12: Ether Fund Flows (Source: CF Benchmarks, Bloomberg as of 9/30/2025)
Expanding the Basis Trading Landscape: Generic Listing Standards and Future Token ETFs
The Securities and Exchange Commission's approval of generic listing standards for crypto-commodity ETPs in September 2025 represents a watershed moment for the digital asset ecosystem. Unlike the bespoke approval process required for Bitcoin and Ether ETFs, these generic standards establish a clear, repeatable framework for listing spot ETFs tied to additional tokens that qualify as commodities under U.S. law.
This regulatory development has immediate implications for tokens like Solana (SOL), which trade actively on CME futures markets but currently lack regulated spot products in the U.S. The generic standards reduce regulatory uncertainty and approval timelines, creating a pathway for multiple token ETFs to launch within a compressed timeframe. As each new spot product comes to market, the infrastructure for sentiment-driven basis trading expands proportionally.
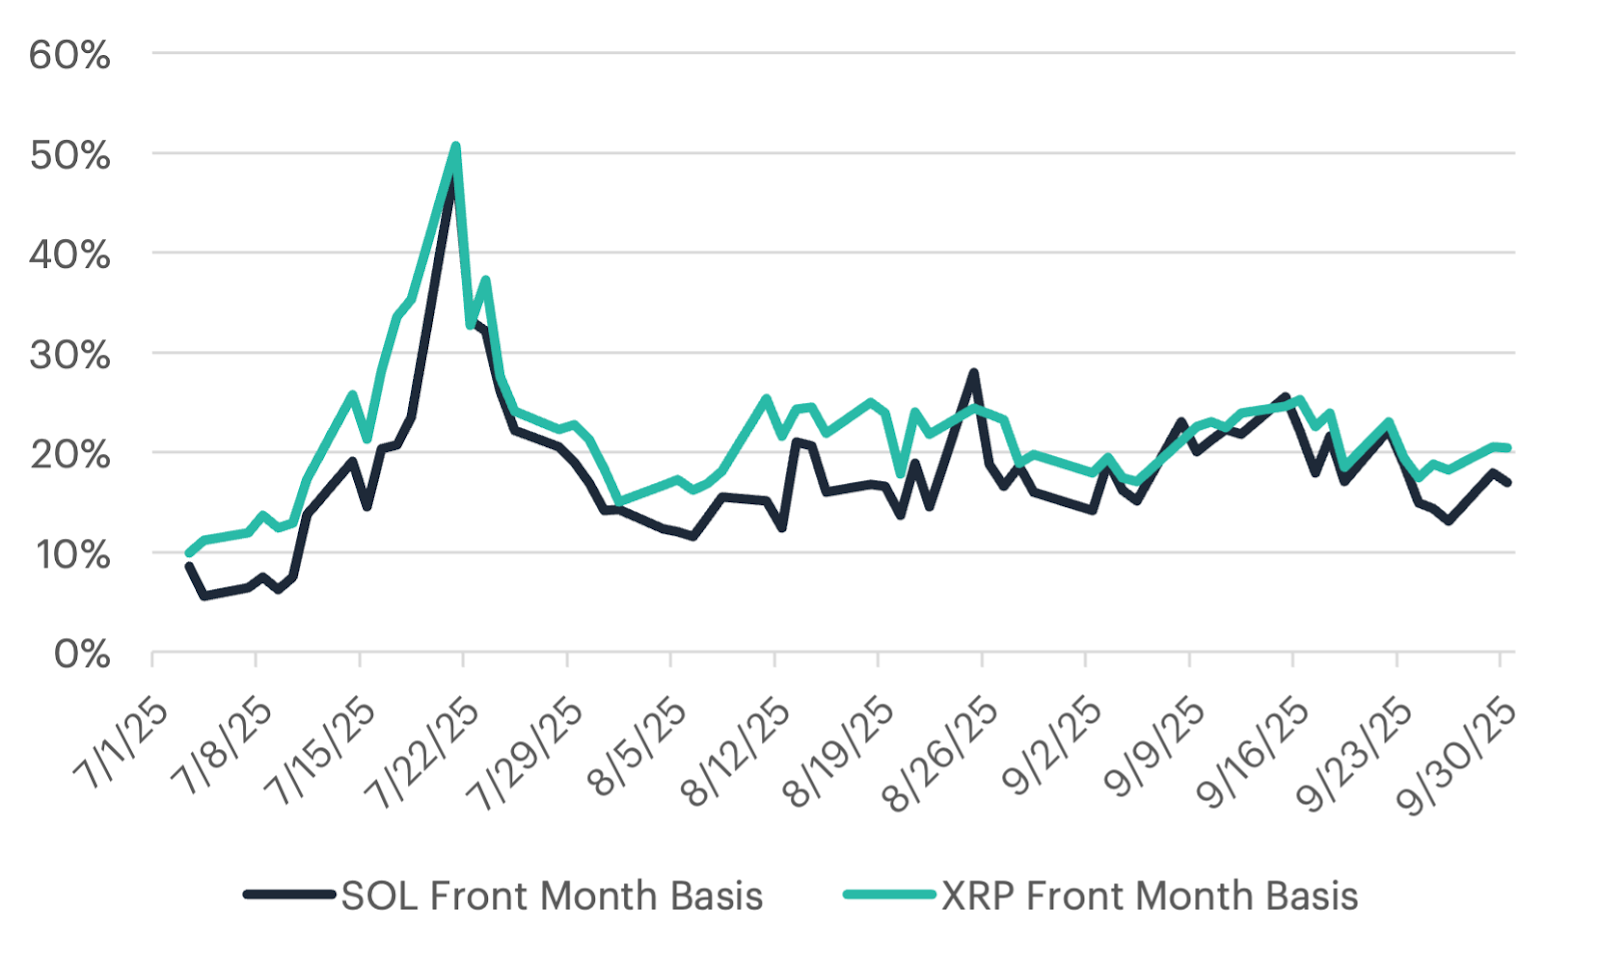
The SOL market offers a particularly compelling preview of this dynamic. In July 2025, the front-month SOL futures contract saw annualized basis readings spike to nearly 50% during volatile periods, with sustained readings above 10% throughout much of the month. These extreme basis levels, far wider than typical Bitcoin readings, reflect the absence of efficient arbitrage mechanisms. Without liquid, regulated spot products, institutional capital cannot flow into the short futures/long spot structure that naturally compresses basis premiums.
Once SOL spot ETFs launch under the generic listing framework, we expect rapid convergence toward patterns observed in Bitcoin and Ether markets. The combination of regulated spot access, aligned pricing benchmarks, and institutional participation should normalize basis levels while introducing the same momentum- and sentiment-driven trading patterns documented throughout this paper. The generic standards effectively create a replicable playbook: each new token that achieves spot ETF status inherits the liquidity infrastructure, arbitrage dynamics, and behavioral characteristics that have transformed Bitcoin basis trading since January 2024.
This proliferation of tradable bases across multiple tokens introduces portfolio-level opportunities as well. Cross-asset sentiment correlations, relative value trades between token bases, and diversified carry strategies become feasible as the number of liquid spot-futures pairs expands. In other words, the generic listing standards represent a structural foundation for a multi-asset basis trading ecosystem that extends well beyond Bitcoin.
Figure 13: Solana and XRP Basis (Source: CF Benchmarks as of 9/30/2025)
Conclusion
The evidence overwhelmingly demonstrates that Bitcoin’s futures basis is driven by a powerful combination of price momentum and investor sentiment, creating technical divergences between spot and futures prices. During aggressive price expansions amid bullish sentiment, such as the post-ETF rally in early 2024 or election-driven optimism in late 2024, institutional and retail demand fosters contango with premiums reaching 15–30% annualized. Conversely, negative momentum and bearish sentiment, as seen in the November 2022 drawdown, drive futures into backwardation as fear dominates market psychology.
This momentum and sentiment-driven relationship, facilitated by aligned pricing benchmarks (e.g., CME CF BRR/BRRNY) and growing institutional adoption of crypto futures, marks a fundamental evolution in derivatives markets. Unlike traditional commodities, crypto’s 24/7 trading, extreme volatility, sentiment driven moves, and perpetual futures markets generate persistent feedback loops that amplify changes in the futures basis.
By integrating sentiment analysis, such as our Bitcoin Fear & Greed Index, with momentum strategies, traders may harvest the Bitcoin basis in a way that enhances risk-adjusted returns. Institutional adoption is accelerating, with firms leveraging behavioral indicators for predictive edge; as sentiment analytics technology advances, these patterns will likely refine rather than fade.
Looking ahead, we anticipate that harvesting the basis will become increasingly popular across other cryptocurrencies, supported by the SEC’s September 2025 generic listing standards. The resulting price singularity created by the use of regulated benchmarks in both ETF and futures markets, combined with broad institutional participation, is cultivating a robust and interconnected ecosystem. As the number of listed ETFs and regulated futures contracts continues to grow, it is likely that an expanding set of market participants will monitor sentiment indicators more closely to capitalize on dislocations and enhance returns in this evolving landscape.
To read the full report, click here
The information contained within is for educational and informational purposes ONLY. It is not intended nor should it be considered an invitation or inducement to buy or sell any of the underlying instruments cited including but not limited to cryptoassets, financial instruments or any instruments that reference any index provided by CF Benchmarks Ltd. This communication is not intended to persuade or incite you to buy or sell security or securities noted within. Any commentary provided is the opinion of the author and should not be considered a personalised recommendation. Please contact your financial adviser or professional before making an investment decision.