
Quarterly Attribution Analysis: CF Web 3.0 Smart Contract Platforms Index
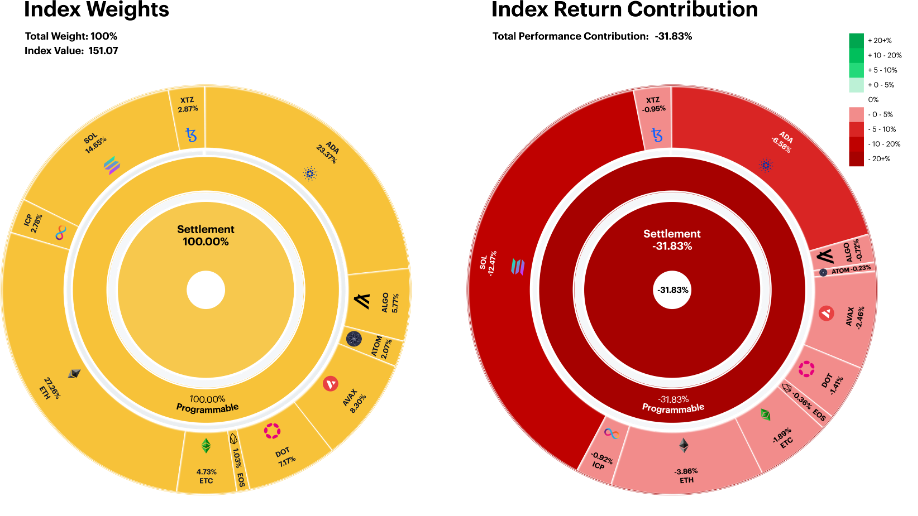
The higher weighting of Solana (SOL), coupled with weak performance, led to a pronounced drag on our Smart Contract Platforms Index. The total negative contribution of SOL for the rebalance period was almost 40% of the index’s total -31.8% decline.
The CF Web 3.0 Smart Contract Platforms Index is a liquid, investible benchmark portfolio index that tracks the return performance of Smart Contract Platforms within the Digital Asset space.The index seeks to capture returns of all eligible protocols under the Settlement category and Programmable sub-category of the CF Digital Asset Classification Structure (DACS). Index constituents are weighted using a capped free-float market capitalization in accordance with the CF Digital Asset Series Ground Rules and the index methodology. The index is calculated and published once a day at 4:00 pm London Time. It is reconstituted on a twice yearly basis and rebalanced quarterly. The CF Web 3.0 Smart Contract Platforms Index was incepted on December 1st 2021 with a value of 1,000. The index was launched on June 28th, all values from inception date to launch date provided are backtested.
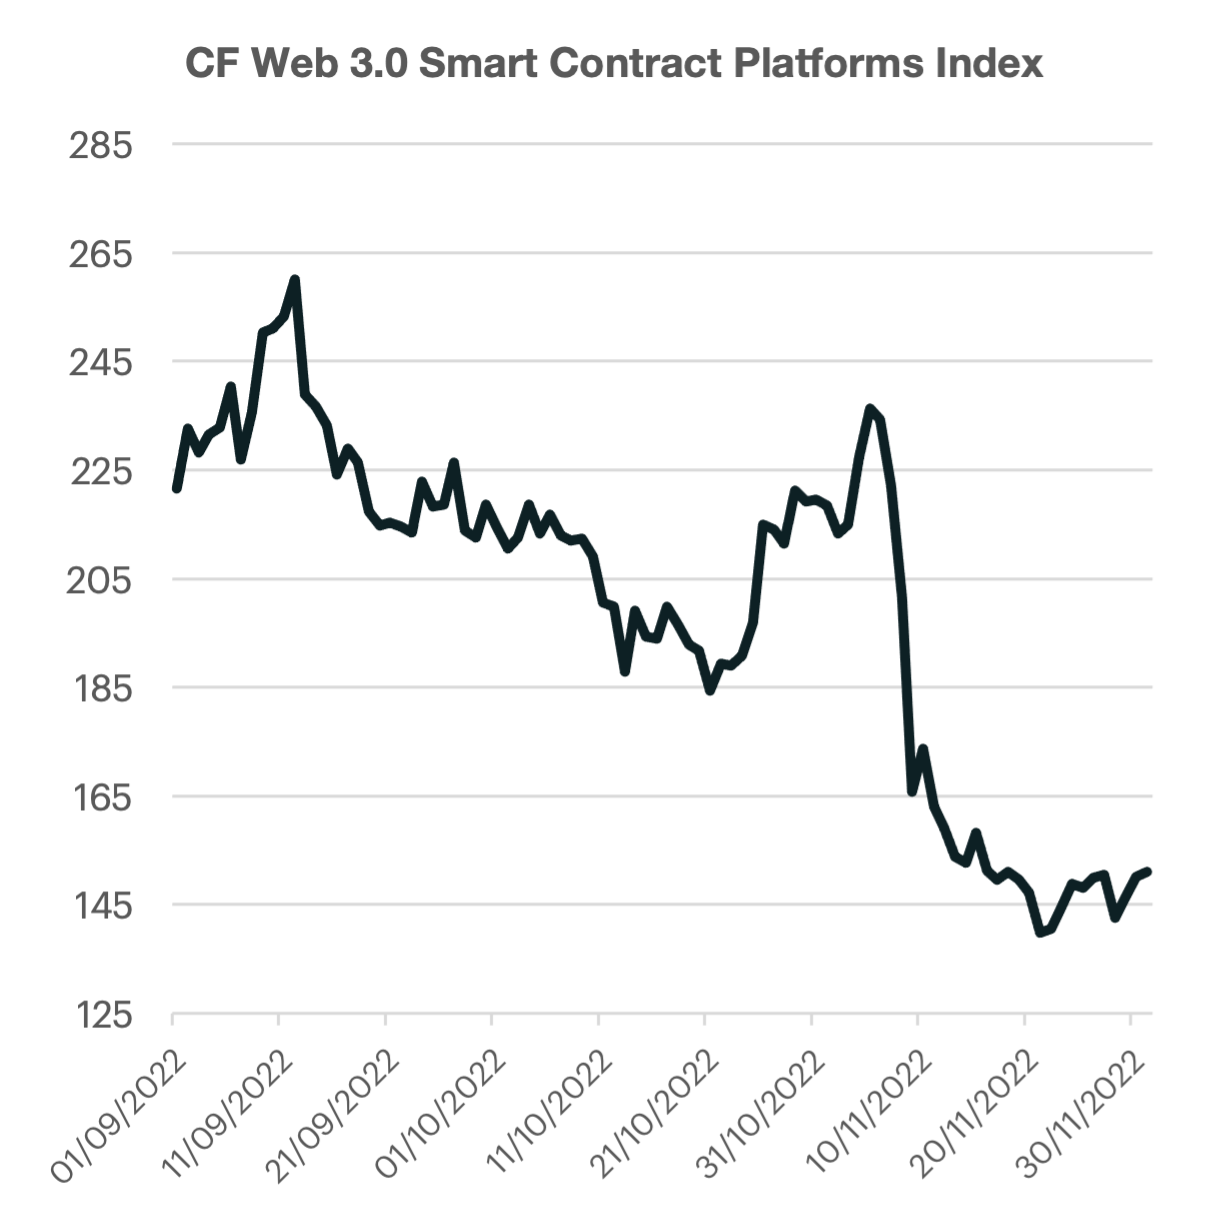
Programmable protocols flatline
Another exogenous shock has led crypto markets lower over the last rebalancing period as one of the world’s largest exchanges surprisingly filed for bankruptcy. The CF Web 3.0 Smart Contract Index was particularly vulnerable due to its exposure to Solana Index, sending the index over 31% lower. The bear market that began earlier this year has only intensified after each over-levered institution or organization collapses. These failures have had a cascading impact on the overall asset class, with the falling prices of crypto markets sparking an industry deleveraging exercise, spreading contagion that leads to even further discounting of crypto assets. Regarding the macroenvironment, risk sentiment has begun to look toward an eventual pivot or slowdown in monetary tightening. The most recent inflationary trends indicate that headline pricing pressures may have peaked in June. This dynamic is expected to be supportive of crypto markets, which face particularly pronounced headwinds from a rising interest rate environment. However, core inflation is likely to be more difficult to tame and the overall level of inflation is likely to remain above any acceptable threshold for some time. This has left crypto market participants in limbo when trying to balance the improving data on the inflation side and spill over impacts from the latest fallout of a major market player.
'Heavyweight Solana’ bites Smart Contracts
The higher weighting of Solana (SOL), coupled with weak performance, led to a pronounced drag on our Smart Contract Platforms Index. The total negative contribution of SOL for the rebalance period was almost 40% of the index’s total -31.8% decline.
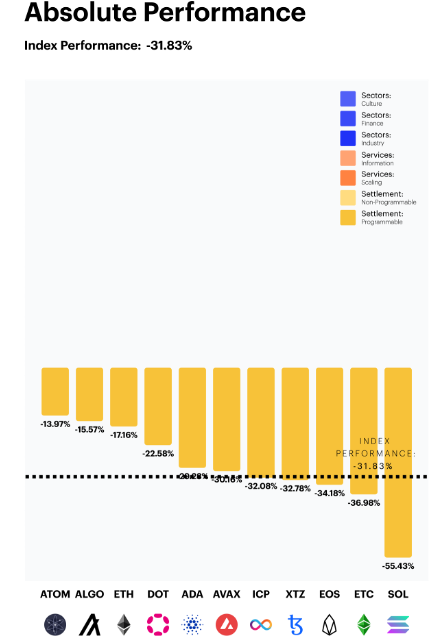
ATOM continued to perform in a relatively defensive manner, providing the smallest negative performance contribution on the portfolio index.
ATOM’s relative momentum intact
Cosmos' native token, ATOM remained the relative outperformer for the second straight period. The “internet of blockchains” token has continued to display lower pricing volatility when compared to the parent index. ETH and ALGO also displayed defensive performance for smart contract investors, each falling approximately half as much in relative terms vs. the index.
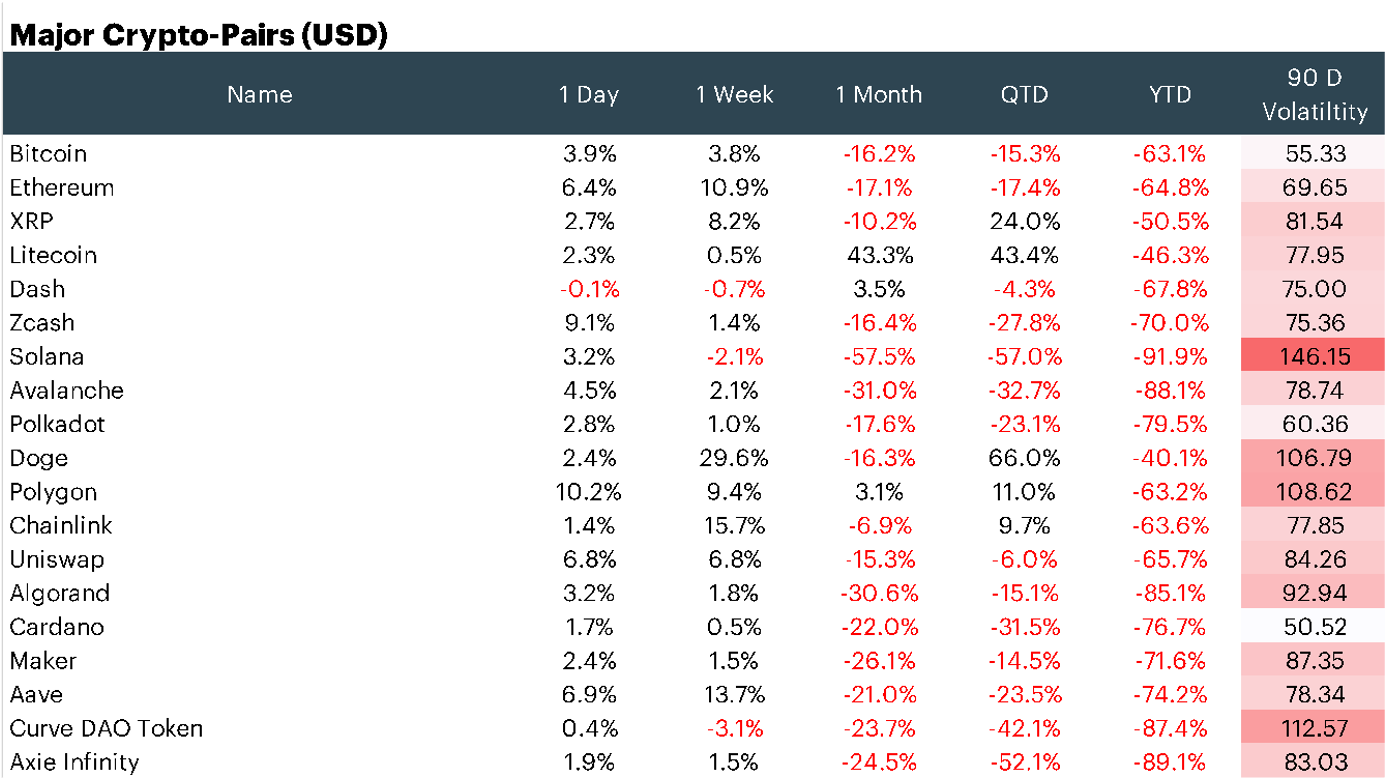
Solana (SOL) prices fell -55.4%, finishing the rebalance period as the worst performer. The Ethereum competitor saw steep price declines due to the fallout of FTX/Alameda where it was reported that the Solana foundation had significant exposure to the now defunct crypto exchange. SOL now trades over 90% lower from its November peak.
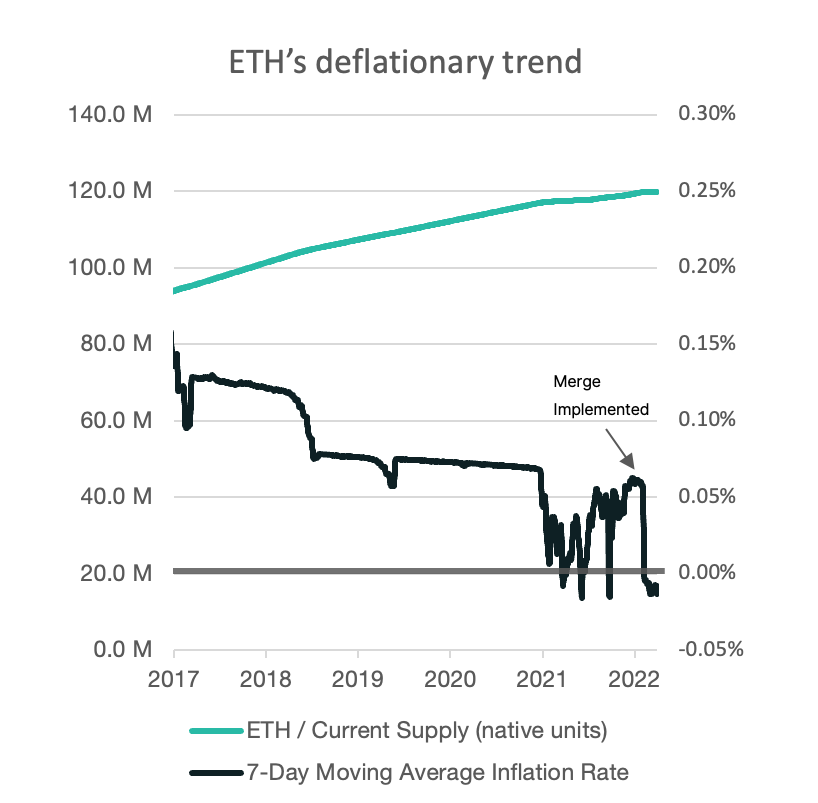
ETH 2.0’s improved tokenomics
Following the recent September upgrade to the Ethereum blockchain, the world's most popular programmable token has seen a shift in its inflationary dynamic. ETH inflation has historically been persistently positive; even after last year's rollout of the EIP-1559 burn mechanism update in August. The 7-day moving average inflation rate has been approximately +0.035% since the EIP-1559 rollout to mid-September 2022.
It now seems that ETH 2.0's new tokenomics and the shift to a proof-of-stake protocol is likely to keep burn rates elevated. This has been especially true after the recent collapse of FTX. According to some estimates, over 53,000 ETH has been burned over the past 30 days, with a large portion of the burn happening immediately after the fallout. This has led to another technical catalyst for ETH going forward.
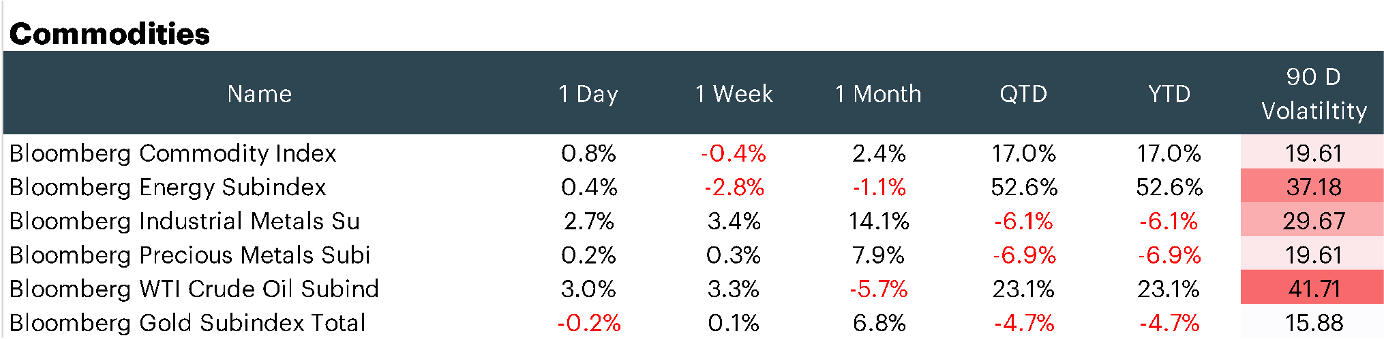
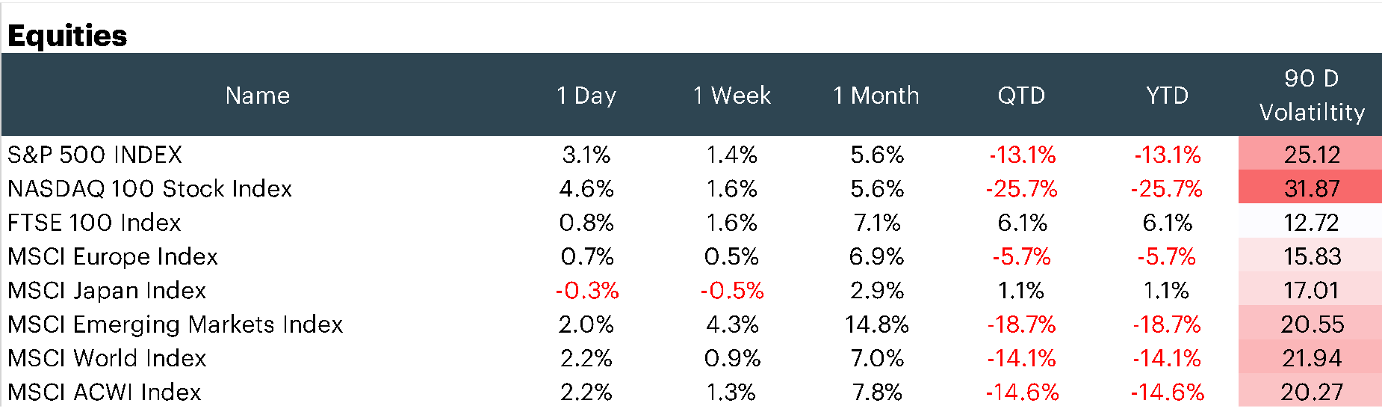
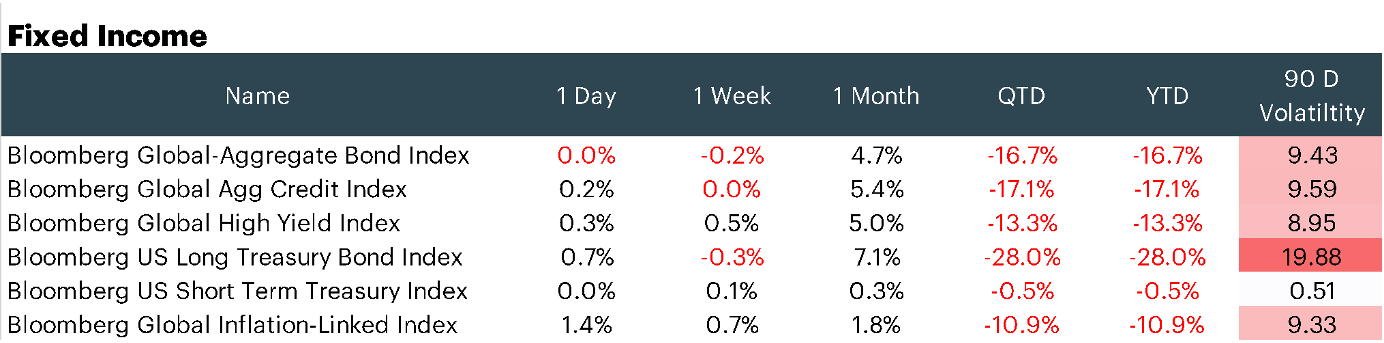
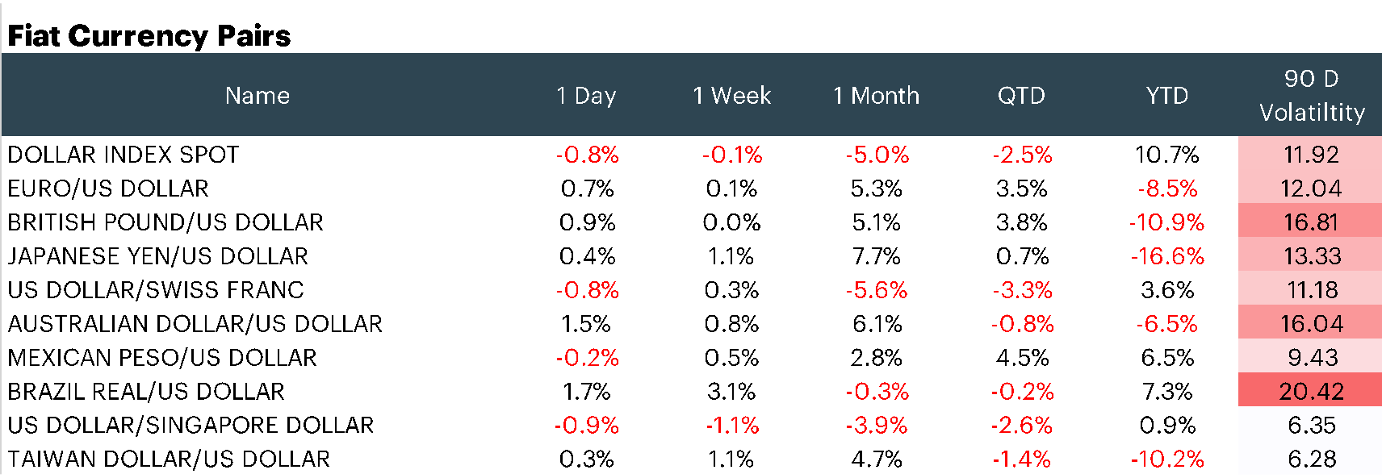
Appendix: Market Performance Overview
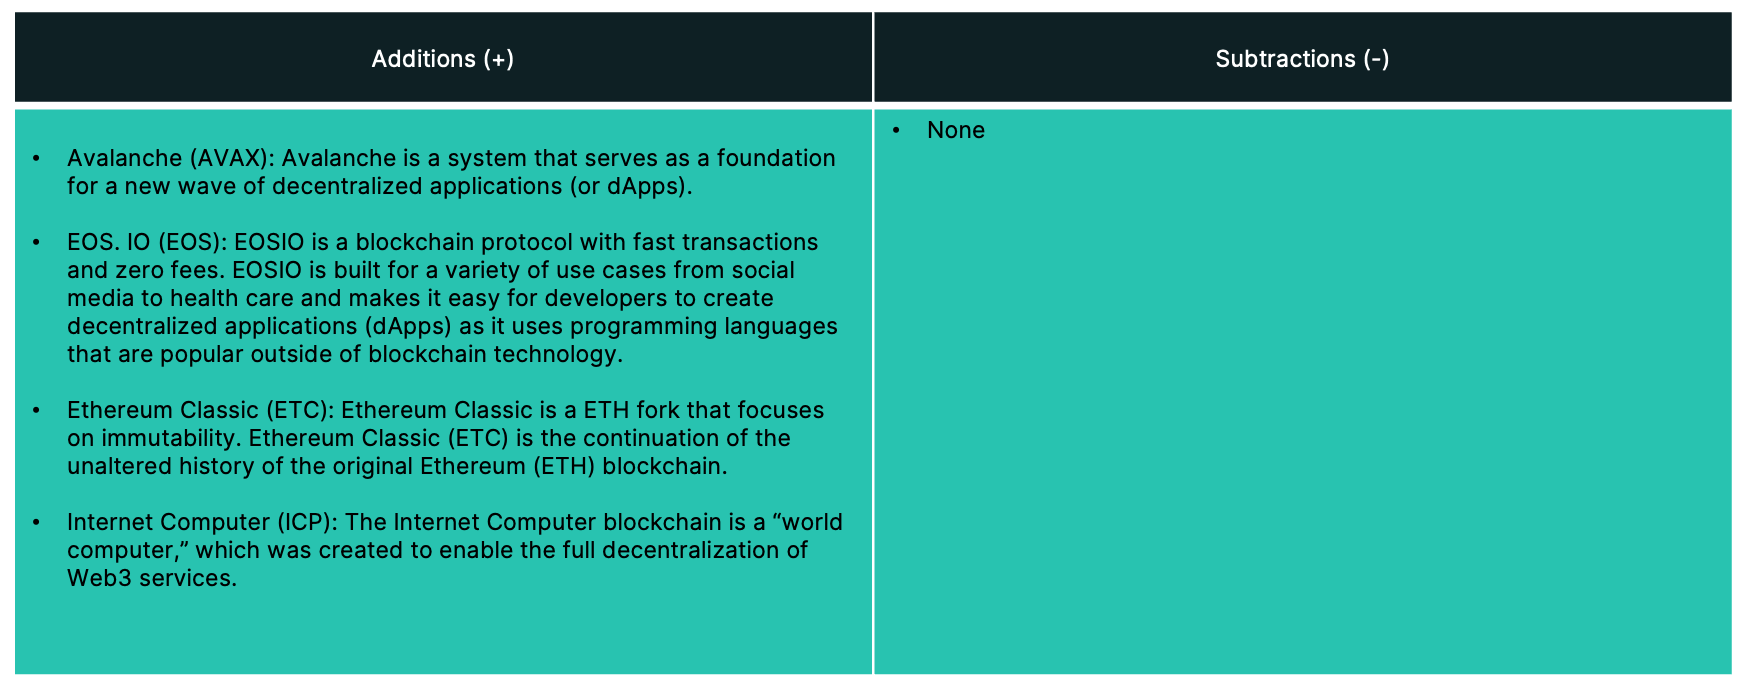
Appendix: constituent changes for current period
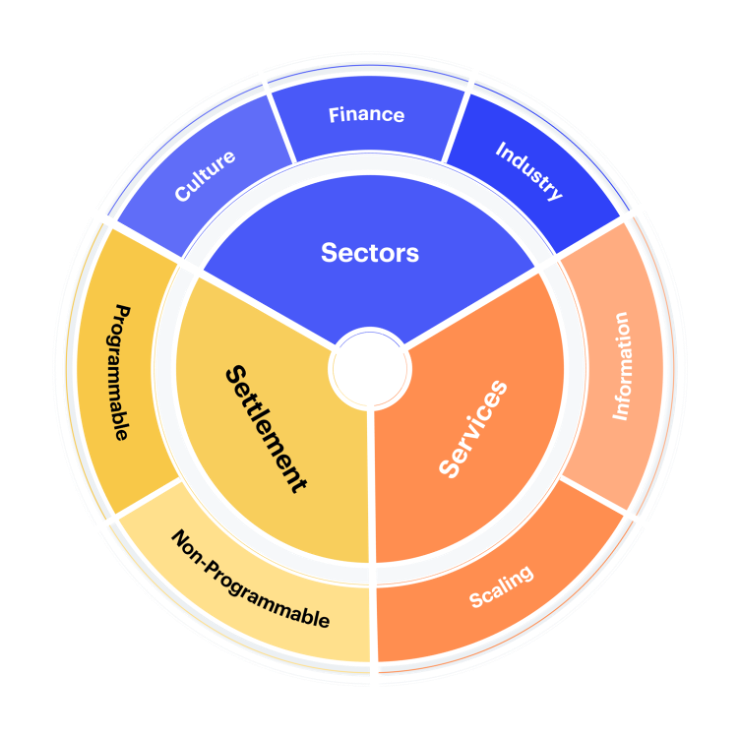
Appendix: CF Digital Asset Classification Structure
The CF Digital Asset Classification Structure (DACS) classifies coins and tokens based on the services that the associated software protocol delivers to end users, grouping assets by the role they play in delivering services to end users. The CF DACS powers CF Benchmarks' sector composite and category portfolio indices and allows users to perform attribution analysis to better understand the fundamental drivers of returns within their digital asset portfolios.
Additional Resources
For more information about our CF Benchmark indices and our methodologies, please visit the respective web links below:
- CF Diversified Large Cap Index
- CF DeFi Composite Index
- CF Web 3.0 Smart Contract Platforms Index
- CF Digital Culture Composite Index
- CF Blockchain Infrastructure Index
- CF Cryptocurrency Ultra Cap 5 Index
Contact Us
Have a question or would like to chat? If so, please drop us a line to:
The information contained within is for educational and informational purposes ONLY. It is not intended nor should it be considered an invitation or inducement to buy or sell any of the underlying instruments cited including but not limited to cryptoassets, financial instruments or any instruments that reference any index provided by CF Benchmarks Ltd. This communication is not intended to persuade or incite you to buy or sell security or securities noted within. Any commentary provided is the opinion of the author and should not be considered a personalised recommendation. Please contact your financial adviser or professional before making an investment decision.