
Quarterly Attribution Analysis: CF Cryptocurrency Ultra Cap 5
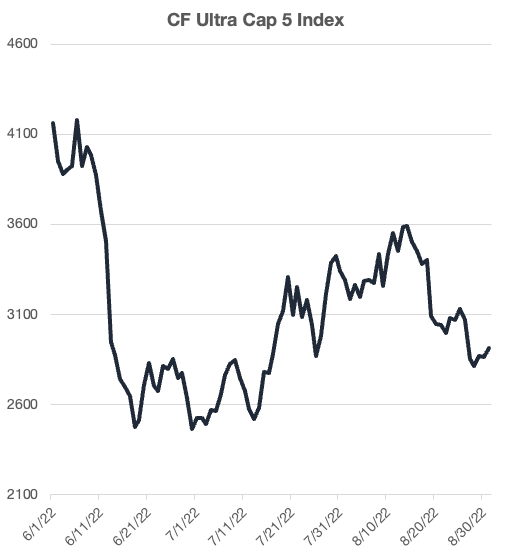
CF Ultra Cap 5 Index has fallen –30.0% over the course of our most recent rebalancing period. Markets have remained vulnerable to increases in central bank policy rates that has led to a tightening of financial conditions

The CF Cryptocurrency Ultra Cap 5 (CFUC5) is an investible benchmark index tracking the performance of a free float market capitalization weighted portfolio of the 5 largest cryptocurrencies by market capitalization. It is the first true measure of the market beta of cryptocurrencies being a Registered Benchmark under EU BMR. All pricing sources for constituents of the index are also themselves Registered Benchmarks. The index is calculated and published once every second in accordance with the methodology. The portfolio composition is determined by the CF Digital Asset Index Family Multi Asset Series Ground Rules with constituent reviews taking place twice a year and monthly rebalancing. The index was launched on August 18th 2020 with an inception date of September 1st 2018 at a value of 1000.
Macro Forces Remain in Control For Now
The challenging macroeconomic environment continued for digital assets: inflation remained at multi-decade highs, central banks made sizable policy rate increases, and global growth has begun to stall. Meanwhile, the CF Ultra Cap 5 Index has fallen –30.0% over the course of our most recent rebalancing period. Markets have remained vulnerable to increases in central bank policy rates that has led to a tightening of financial conditions in an effort to stymie inflation in most developed market economies. Although this dynamic has been visible across most risky assets, such as equities, the naturally higher volatility in the digital asset space has amplified downside price action.
It is worth noting that macro forces were not the only driving force this past quarter. Idiosyncratic catalysts stemming from the upcoming Ethereum Proof-of-Stake (PoS) upgrade, or “merge”, helped bolster price momentum. At one point, ETH prices rose as much as +90% from the late June lows, leading the world’s second largest token (by market capitalization) to be one of the top relative performers in the large-cap space.
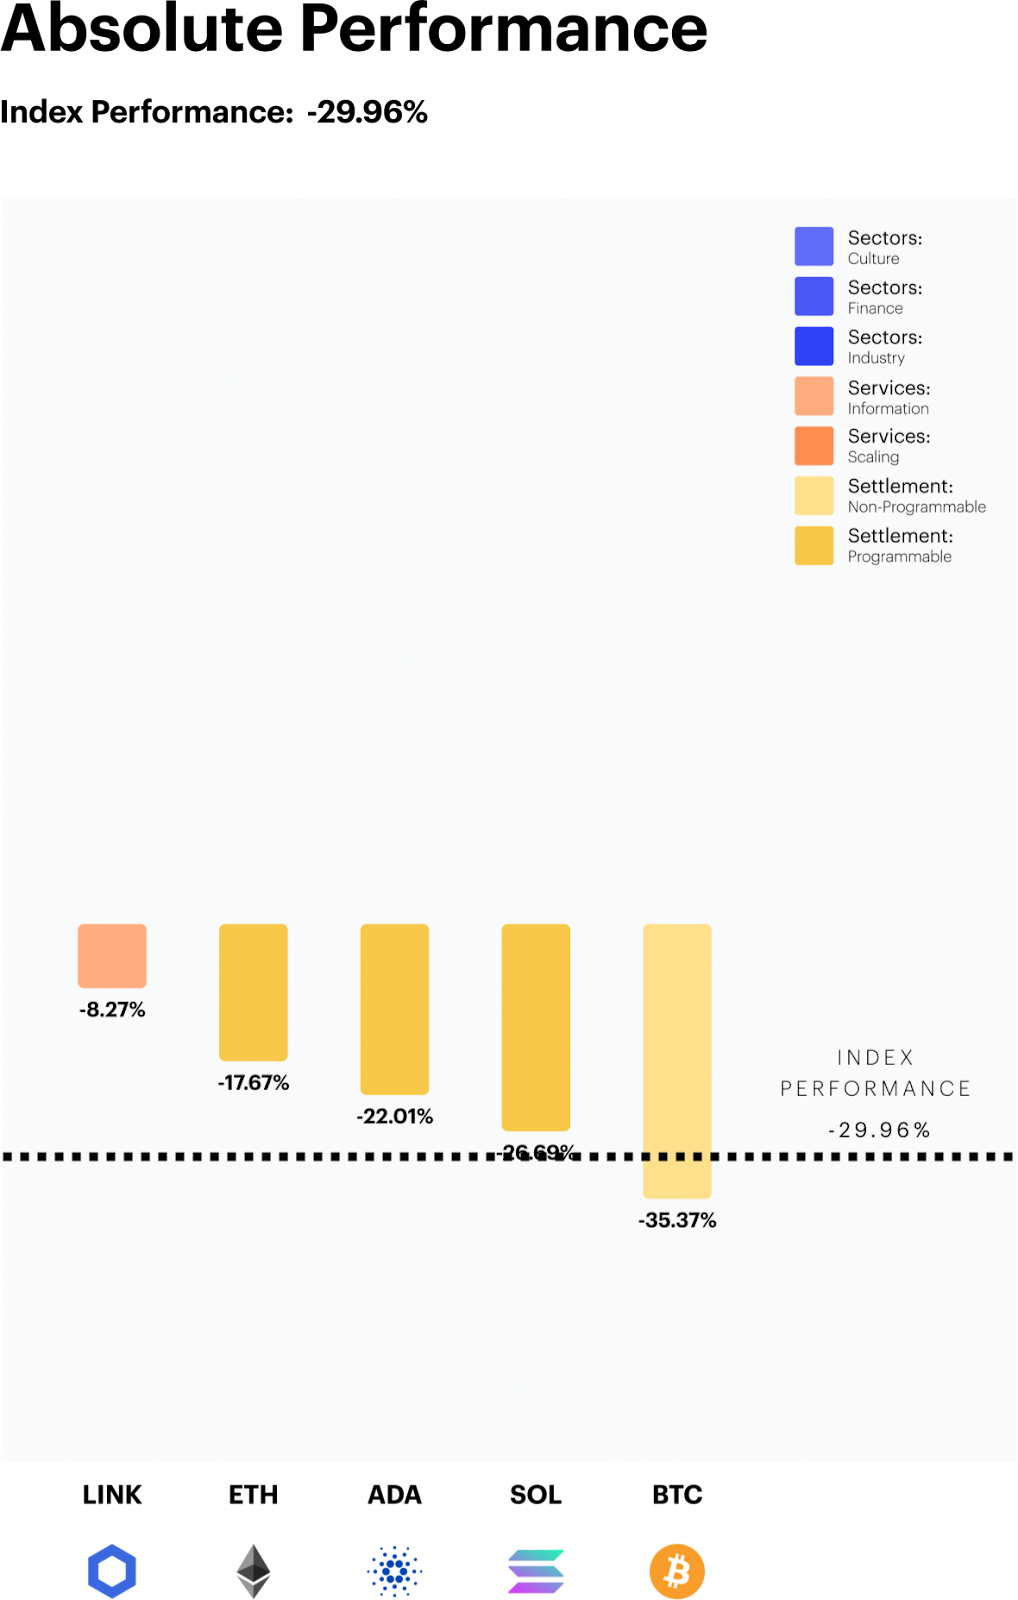
Heavyweight BTC Sinks Bluechips
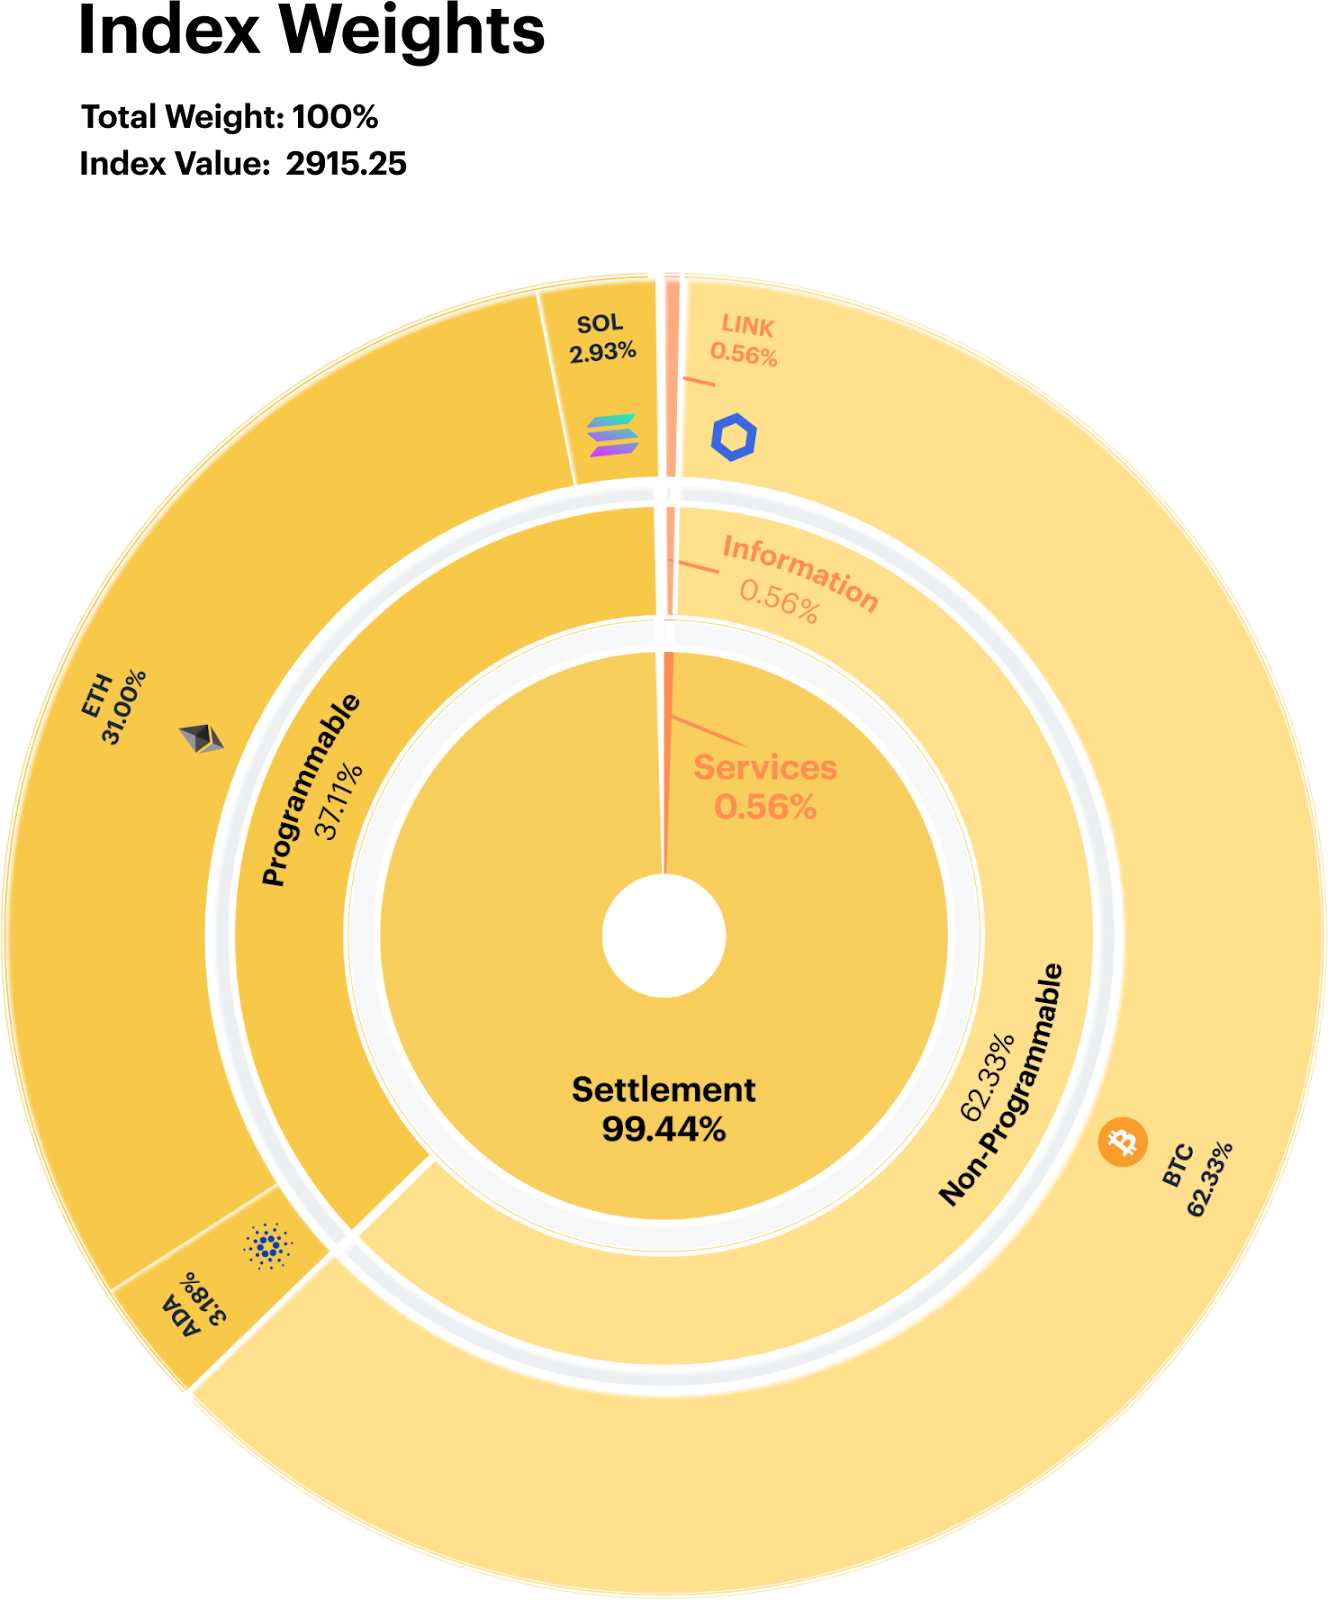
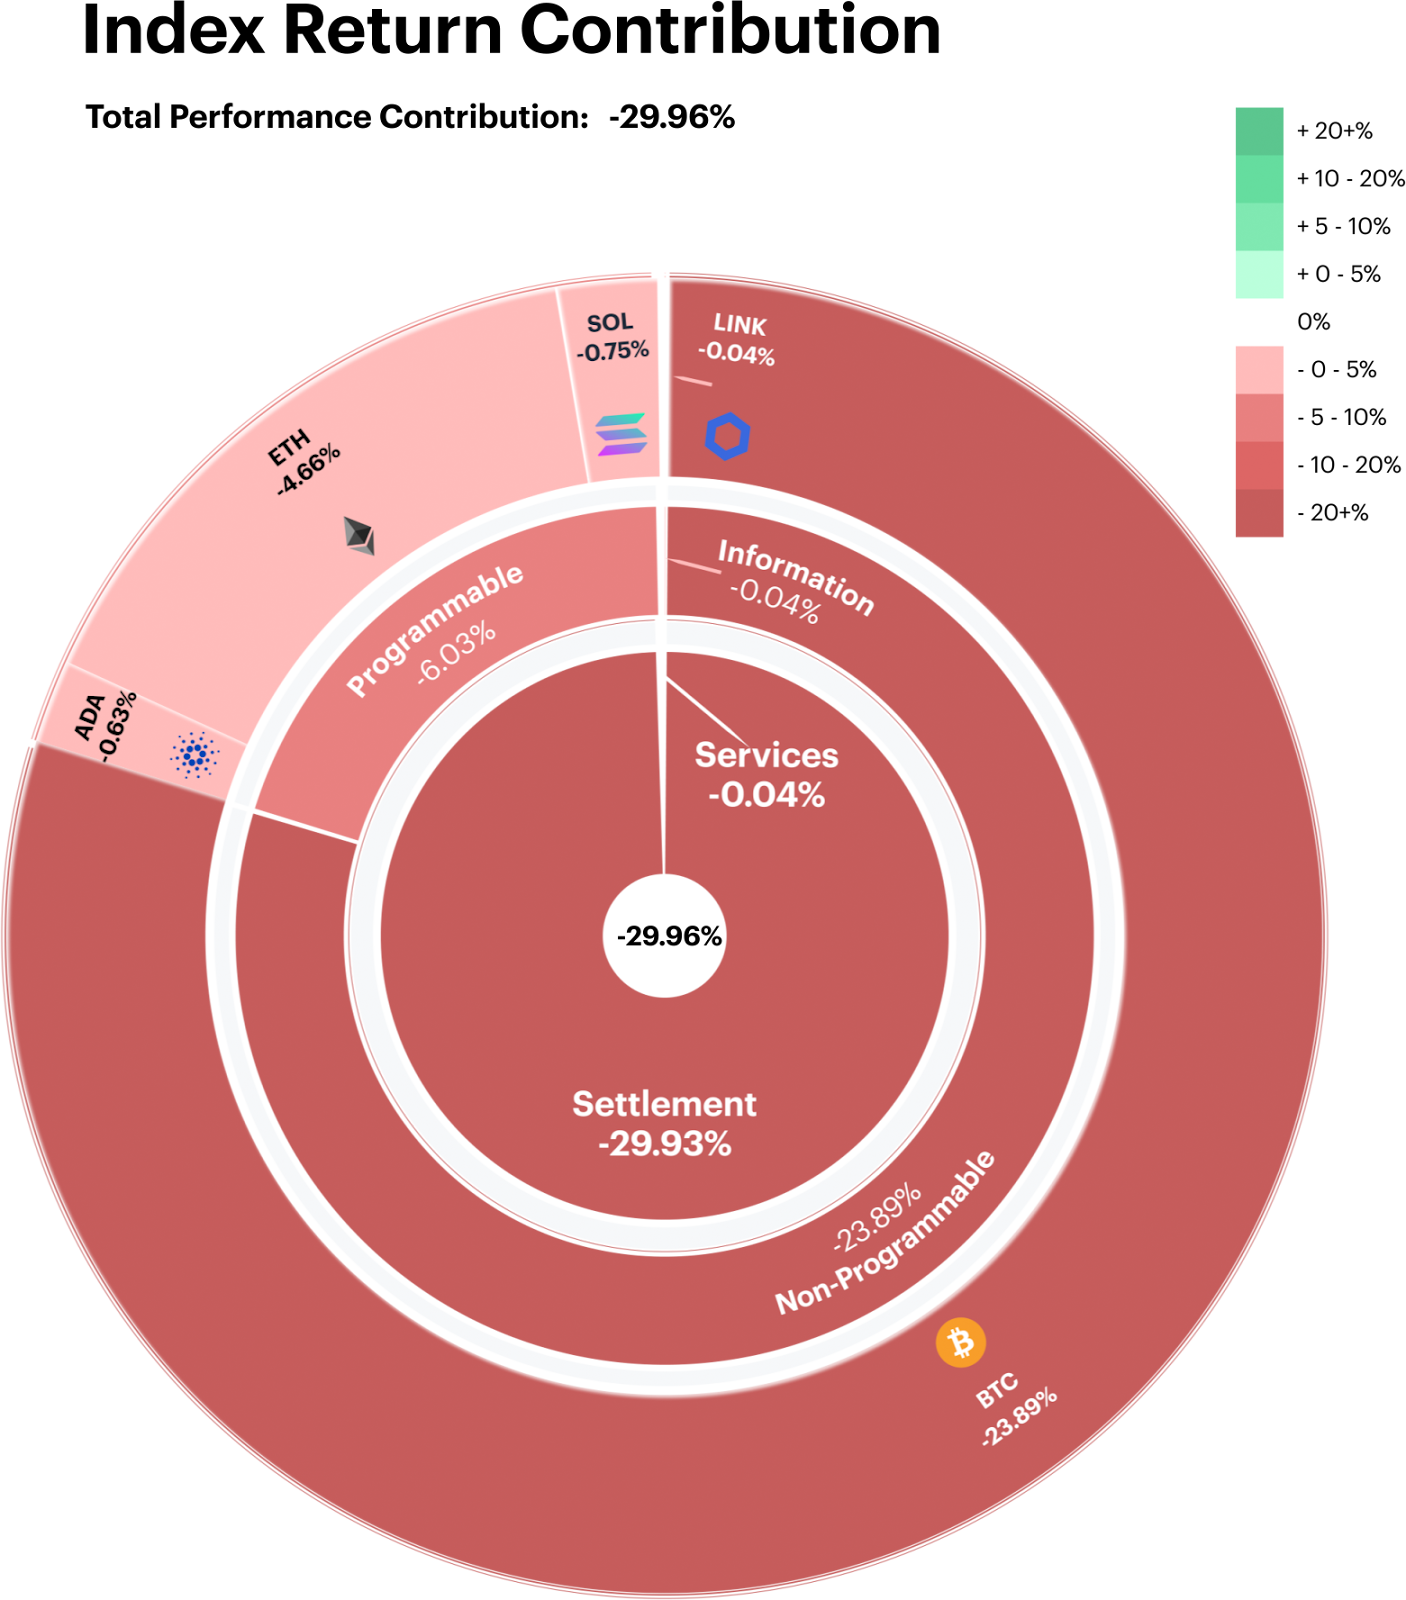
Our barometer for blue-chip tokens remained under pressure, falling approximately -30% over the last rebalancing period. The composition of the index is heavily concentrated in the Settlement Segment which contributes over 99% of the total weighting.
From a Level 2 Digital Asset Classification Structure (DACS) perspective, the relative performance contribution of the non-programmable segment was 17% worse in absolute terms than the programmable.
BTC Dominance Fades
Bitcoin’s relative strength faded over the past rebalancing period. In the first half of the year, the world’s largest token was outperforming its UC5 peers by margin of +16% to +40%. This performance lead has been reduced significantly over the past three months. The surprise timeline announcement for the Ethereum blockchain merge has even allowed BTC to be overtaken by ETH in the year-to-date performance tables.
Chainlink (LINK) fared the best out of the remaining UC5 peers. Investor demand has been strong at the token’s $6 support level. The second-best performer was ETH as all eyes remain focused on its blockchain’s transition over to Proof-of-Stake (POS). This switch is anticipated to enable a series of fundamental bullish features centered around increased efficiency and bandwidth.
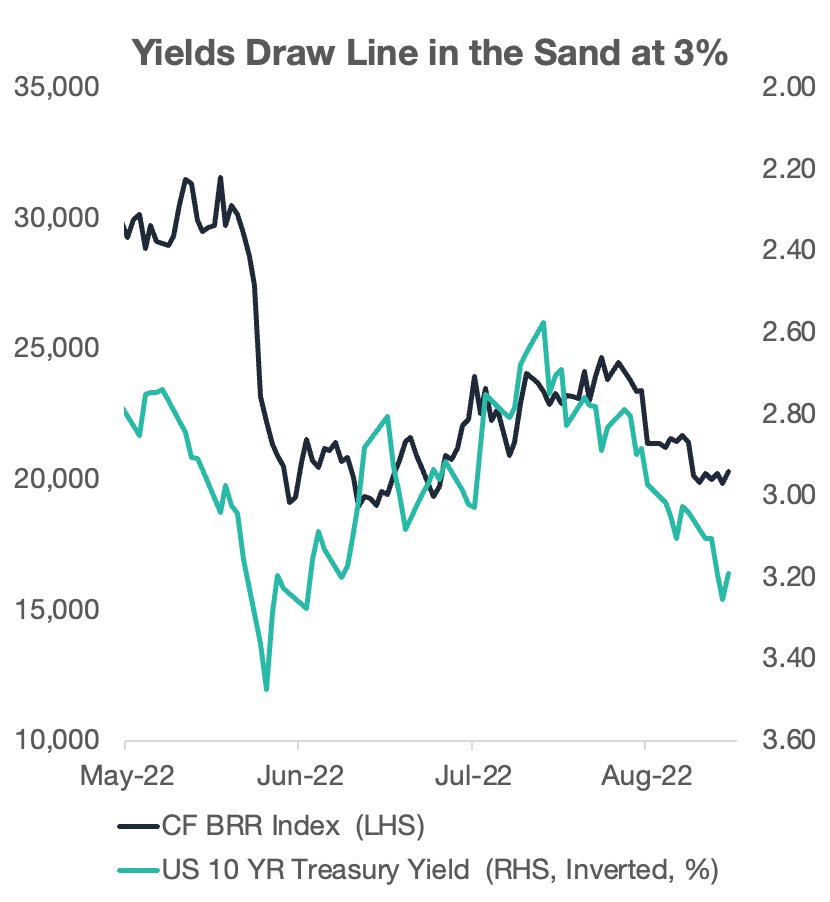
Yields Cross Key Level
10-year Treasury rates recently surpassed a key psychological level. Bitcoin, as measured by our BRR Index, represents approximately 60% of our CF Ultra Cap 5 Index and remains a key barometer for crypto. The chart attached illustrates how Bitcoin has historically displayed an increase in pricing volatility - with negative price action - as 10-year rates approach or cross the 300bps mark.
Bitcoin prices have certainly reacted negatively to the most recent 3% crossover, with prices declining from $25K to the $20K support levels seen this past June. However, price action was relatively less severe and investor sentiment is noticeably stabilizing much faster. This dynamic of retesting market headwinds with added resilience illustrates how the market may be more comfortable in facing a period of higher rates.
Bitcoin Enters a Seasonally Challenging Month
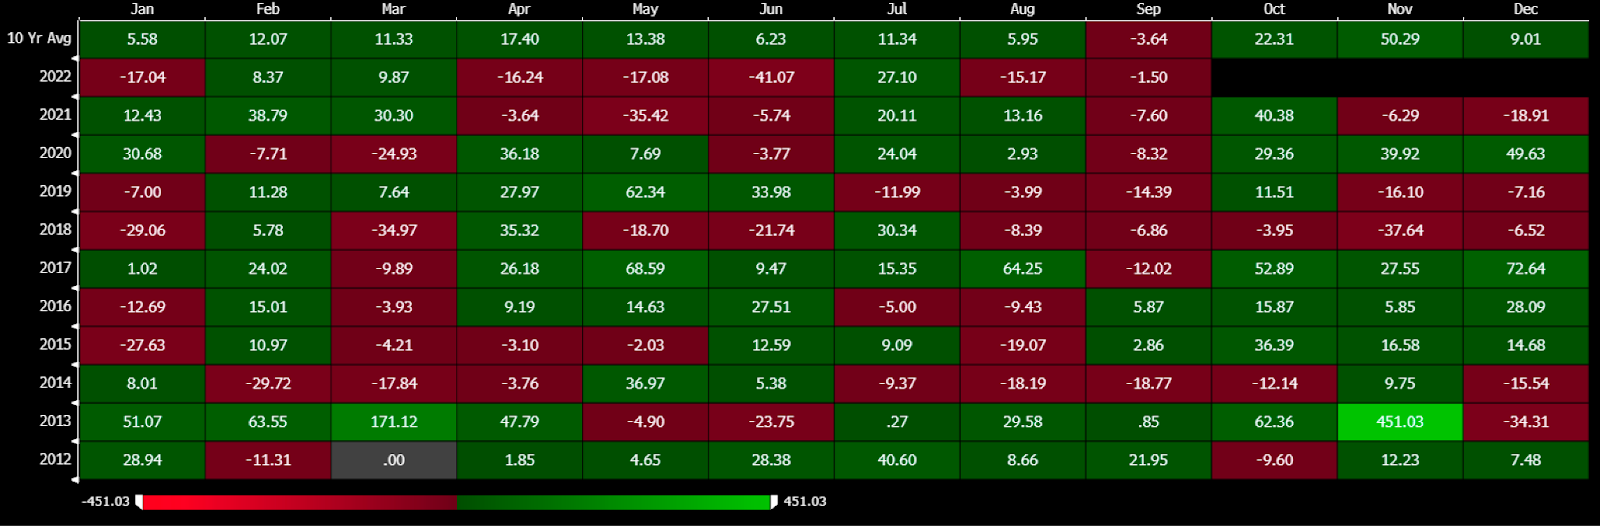
Bitcoin has historically seen challenging price action in the month of September. Over the course of the last 10 years, the month of September has on average trimmed 3.64% from Bitcoin’s value, with the worst monthly drawdown occurring back in 2014. However, it is worth highlighting that September is the only month to average negative price performance over this observation window. Furthermore, the subsequent two months have been seasonally the most fruitful for Bitcoin bulls.
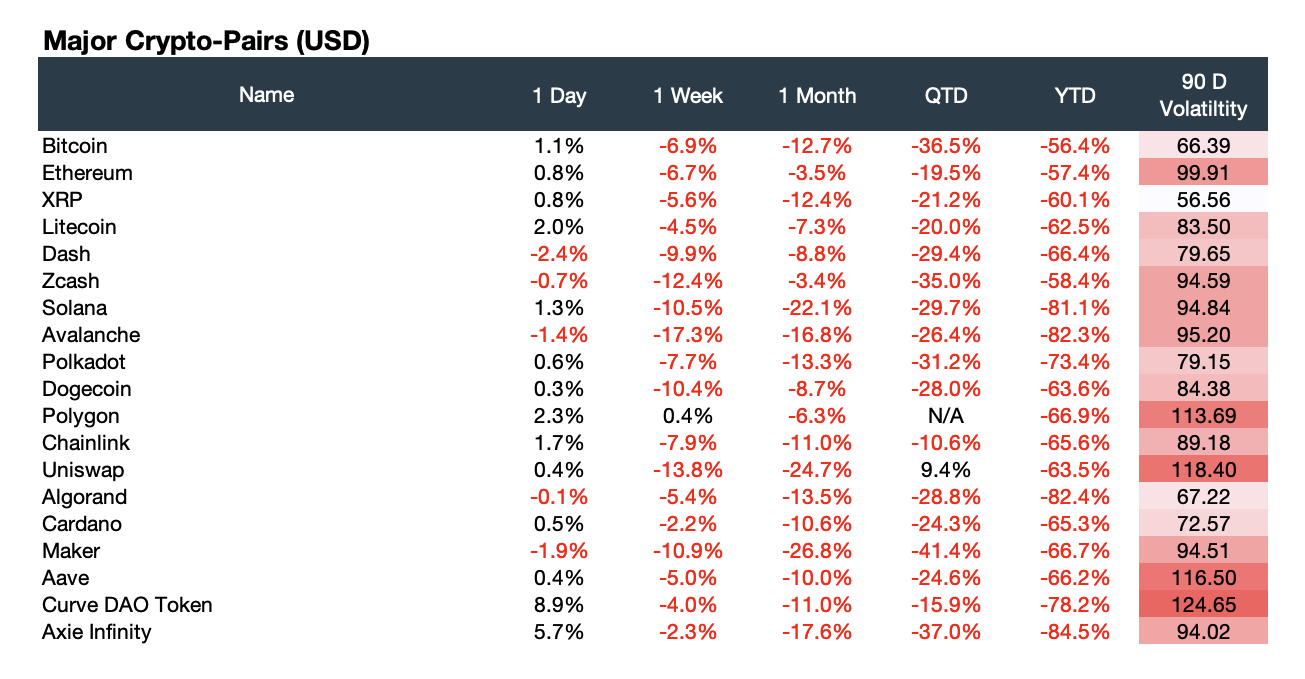
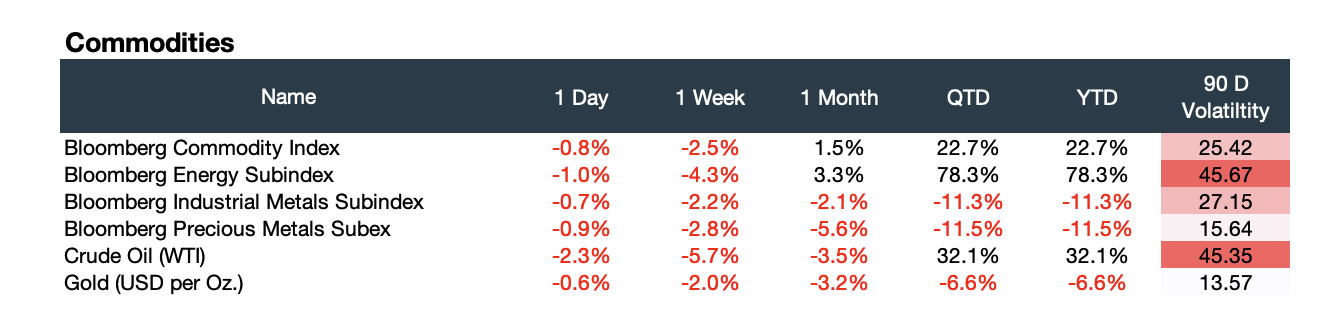
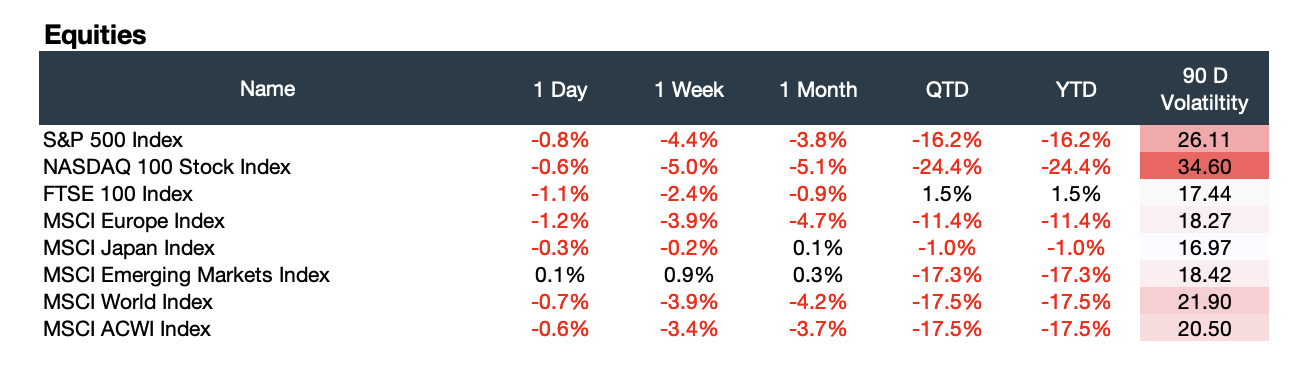
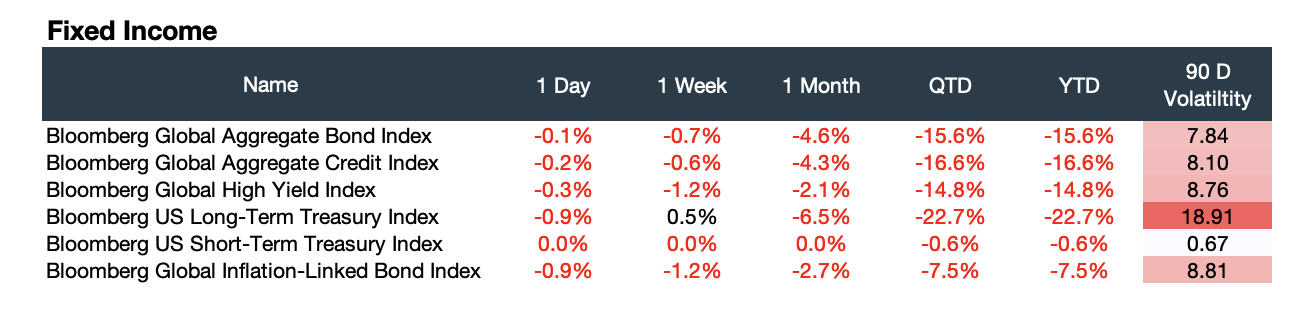
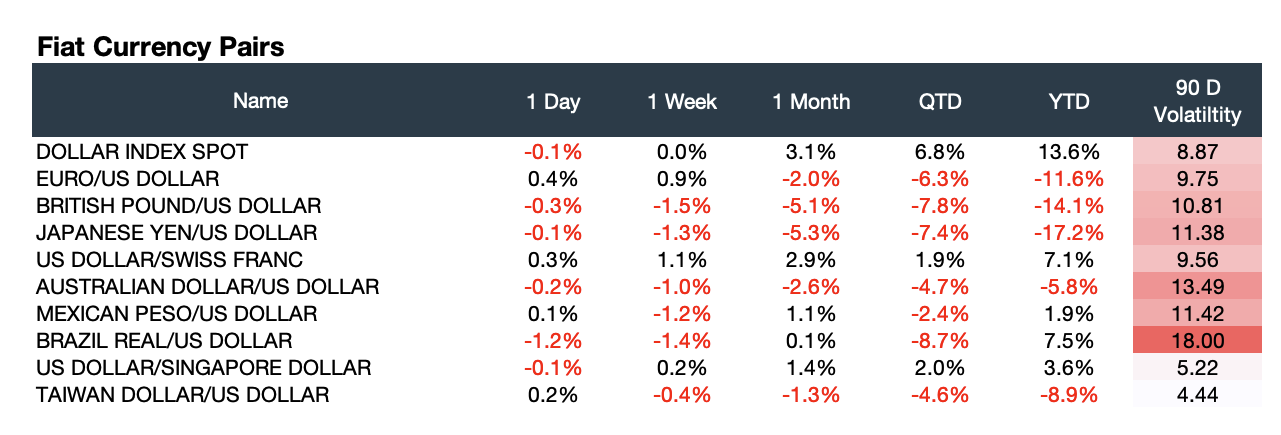
Appendix: Market Performance Overview
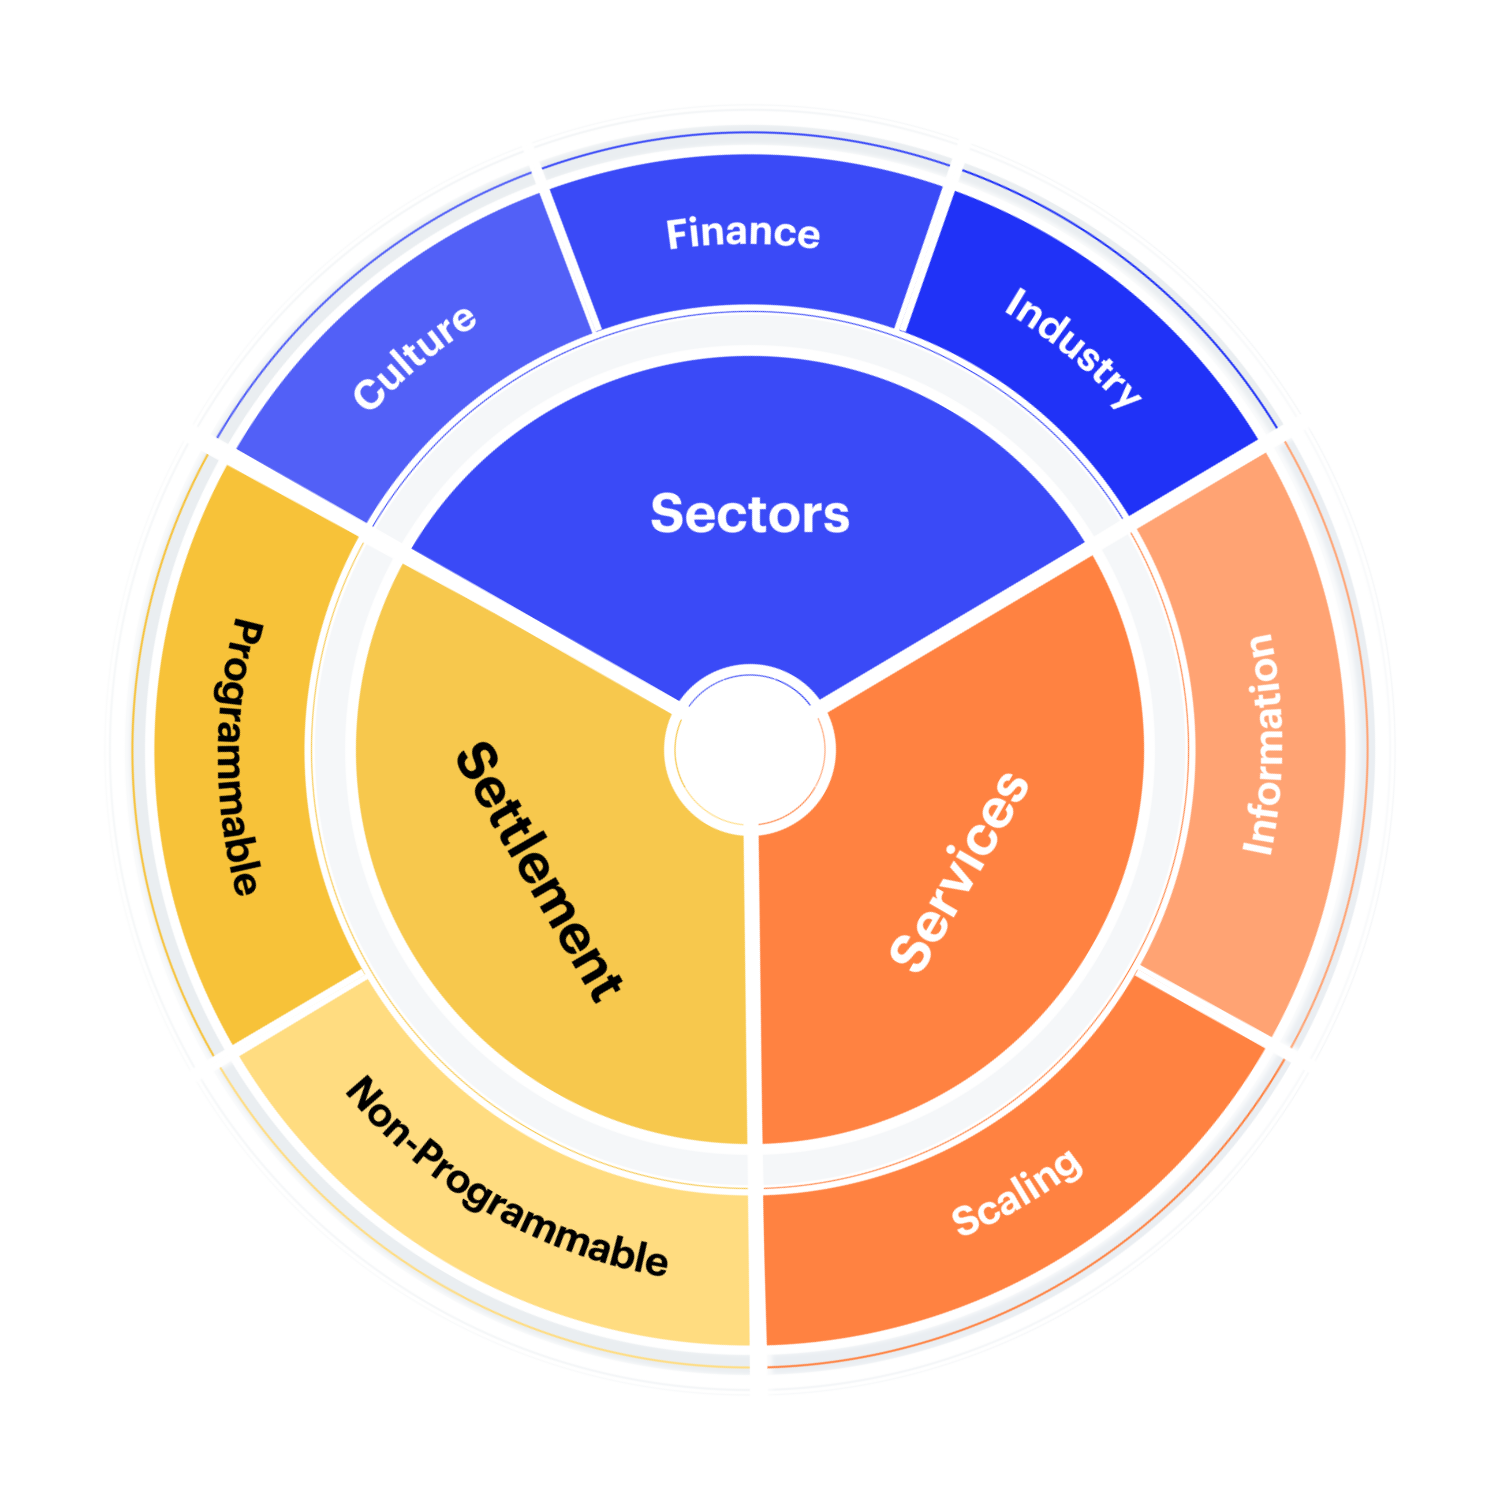
Appendix: CF Digital Asset Classification Structure
The CF Digital Asset Classification Structure (DACS) classifies coins and tokens based on the services that the associated software protocol delivers to end users, grouping assets by the role they play in delivering services to end users. The CF DACS powers CF Benchmarks' sector composite and category portfolio indices and allows users to perform attribution analysis to better understand the fundamental drivers of returns within their digital asset portfolios.
Additional Resources
For more information about our CF Benchmark indices and our methodologies, please visit the respective web links below:
- CF Diversified Large Cap Index
- CF DeFi Composite Index
- CF Web 3.0 Smart Contract Platforms Index
- CF Digital Culture Composite Index
- CF Blockchain Infrastructure Index
- CF Cryptocurrency Ultra Cap 5 Index
Contact Us
Have a question or would like to chat? If so, please drop us a line to:
The information contained within is for educational and informational purposes ONLY. It is not intended nor should it be considered an invitation or inducement to buy or sell any of the underlying instruments cited including but not limited to cryptoassets, financial instruments or any instruments that reference any index provided by CF Benchmarks Ltd. This communication is not intended to persuade or incite you to buy or sell security or securities noted within. Any commentary provided is the opinion of the author and should not be considered a personalised recommendation. Please contact your financial adviser or professional before making an investment decision.