
Quarterly Attribution Analysis: CF Web 3.0 Smart Contract Platforms Index
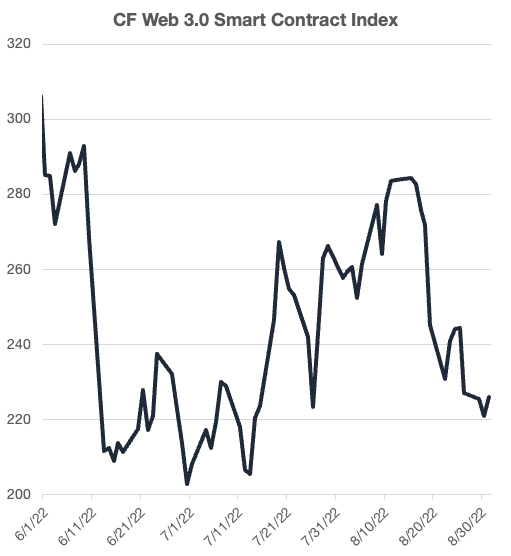
The CF Web 3.0 Smart Contract Platforms Index has fallen -20.7% over the course of our most recent rebalancing period

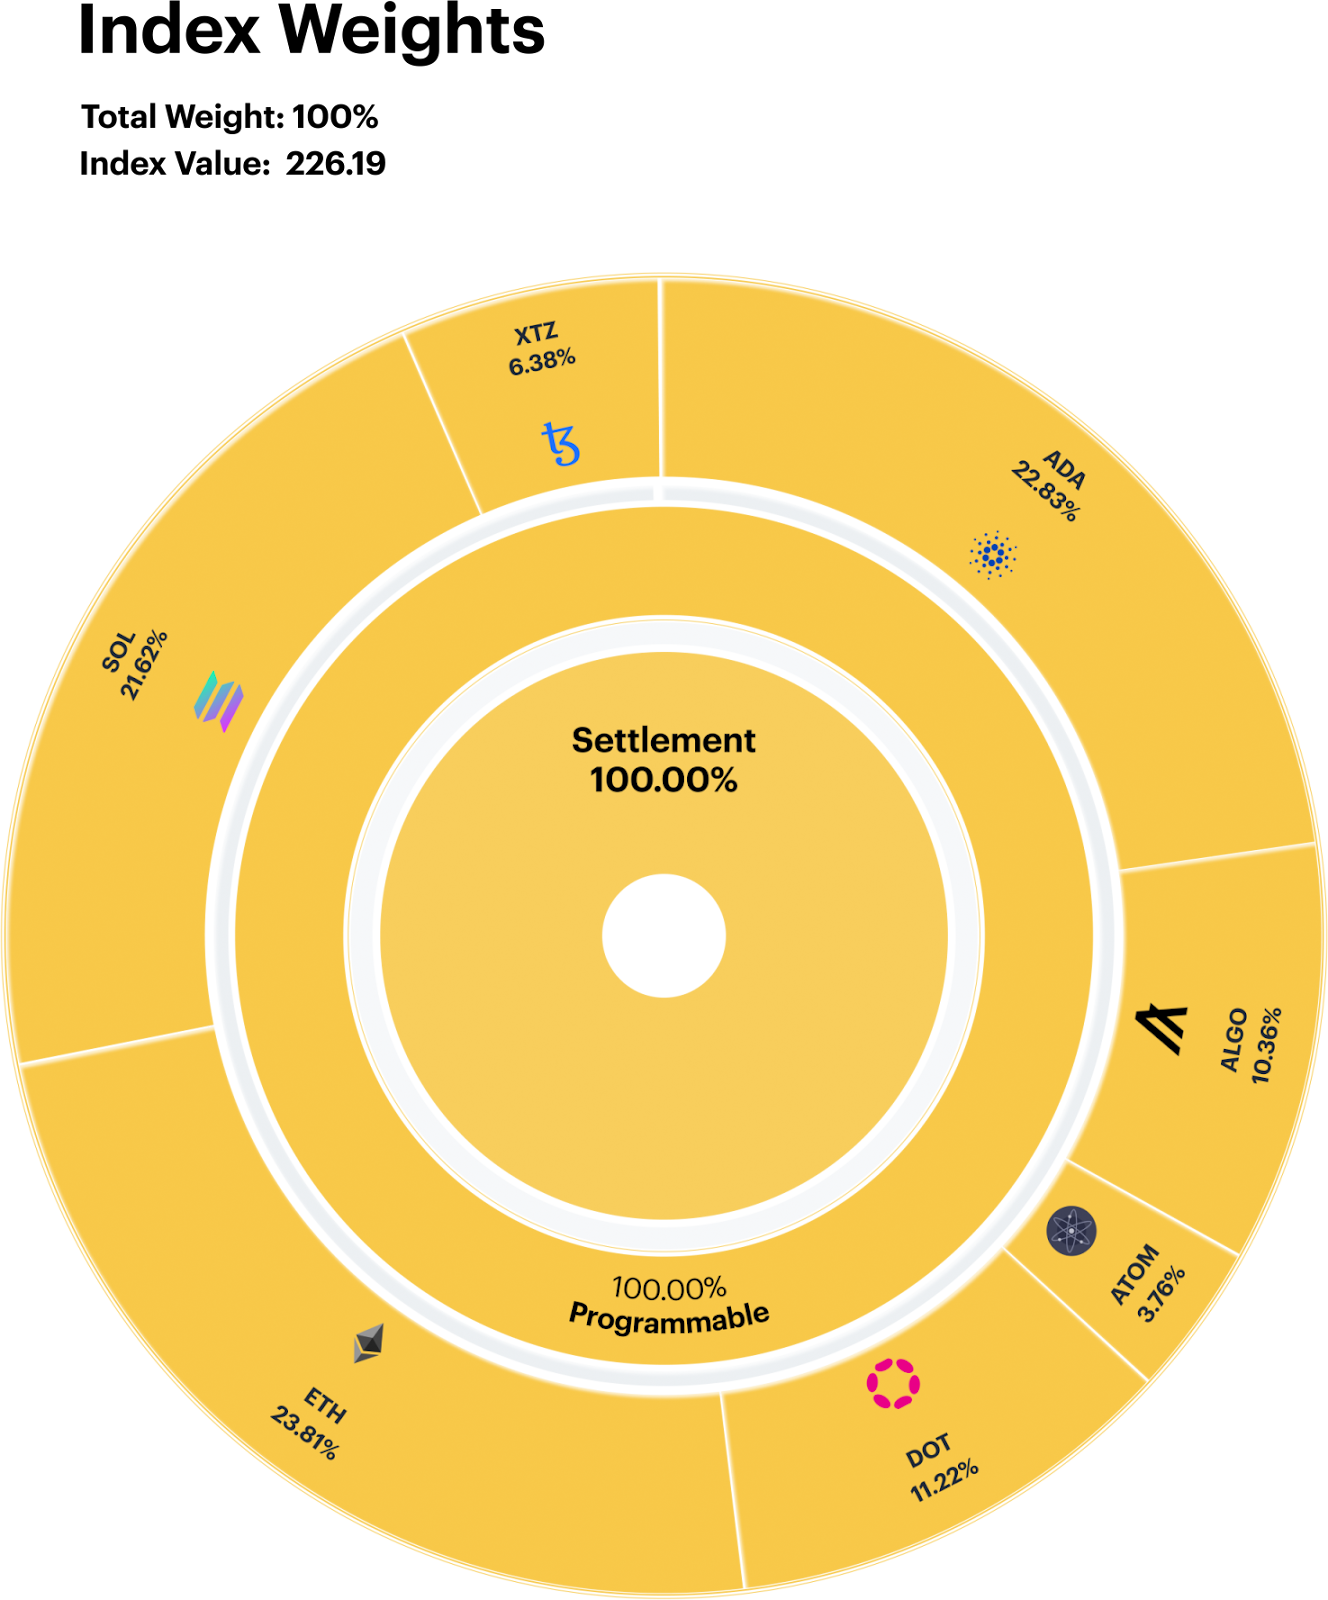
The CF Web 3.0 Smart Contract Platforms Index - is a liquid, investible benchmark portfolio index that tracks the return performance of Smart Contract Platforms within the Digital Asset space. The index seeks to capture returns of all eligible protocols under the Settlement category and Programmable sub-category of the CF Digital Asset Classification Structure (DACS). Index constituents are weighted using a capped free-float market capitalization in accordance with the CF Digital Asset Series Ground Rules and the index methodology. The index is calculated and published once a day at 4:00 pm London Time. It is reconstituted on a twice yearly basis and rebalanced quarterly. The CF Web 3.0 Smart Contract Platforms Index was incepted on December 1st 2021 with a value of 1,000. The index was launched on June 28th, all values from inception date to launch date provided are backtested.
Programmable Protocols Lose Steam
The challenging macroeconomic environment continued for digital assets: inflation remained at multi-decade highs, central banks have made sizable policy rate increases, and global growth has begun to stall. Meanwhile, the CF Web 3.0 Smart Contract Platforms Index has fallen -20.7% over the course of our most recent rebalancing period. Markets have remained vulnerable to increases in central bank policy rates that has led to a tightening of financial conditions in an effort to stymie inflation in most developed market economies. Although this dynamic has been visible across most risky assets, such as equities, the naturally higher volatility in the digital asset space has amplified downside price action.
It is worth noting that macro forces were not the only driving force this past quarter. ETH set itself apart as a new fundamental catalysts emerged from the upcoming Proof-of-Stake (PoS) upgrade (or “merge”) which helped bolster price momentum. At one point, ETH prices rose as much as 90% from the June lows.
SOL & ADA Drive Index Lower
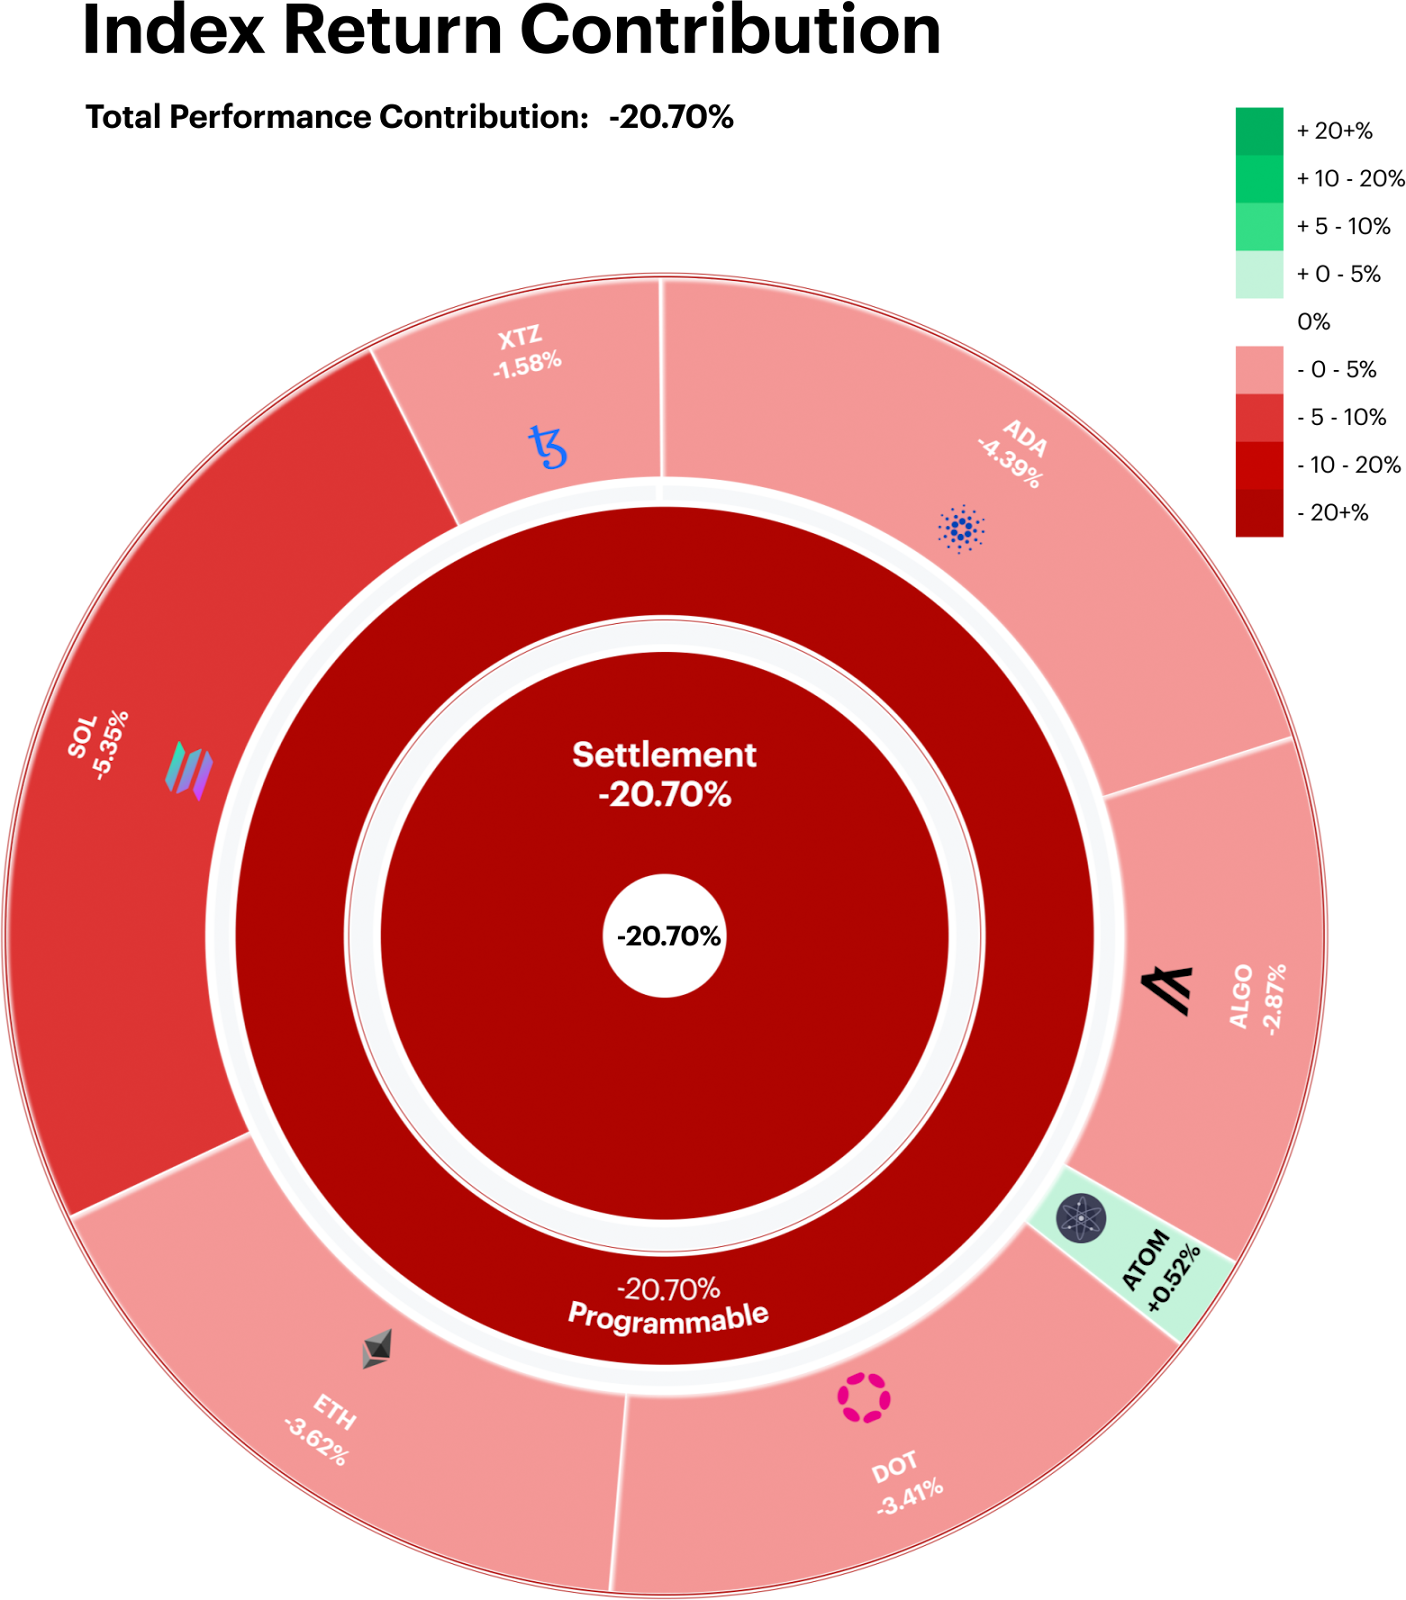
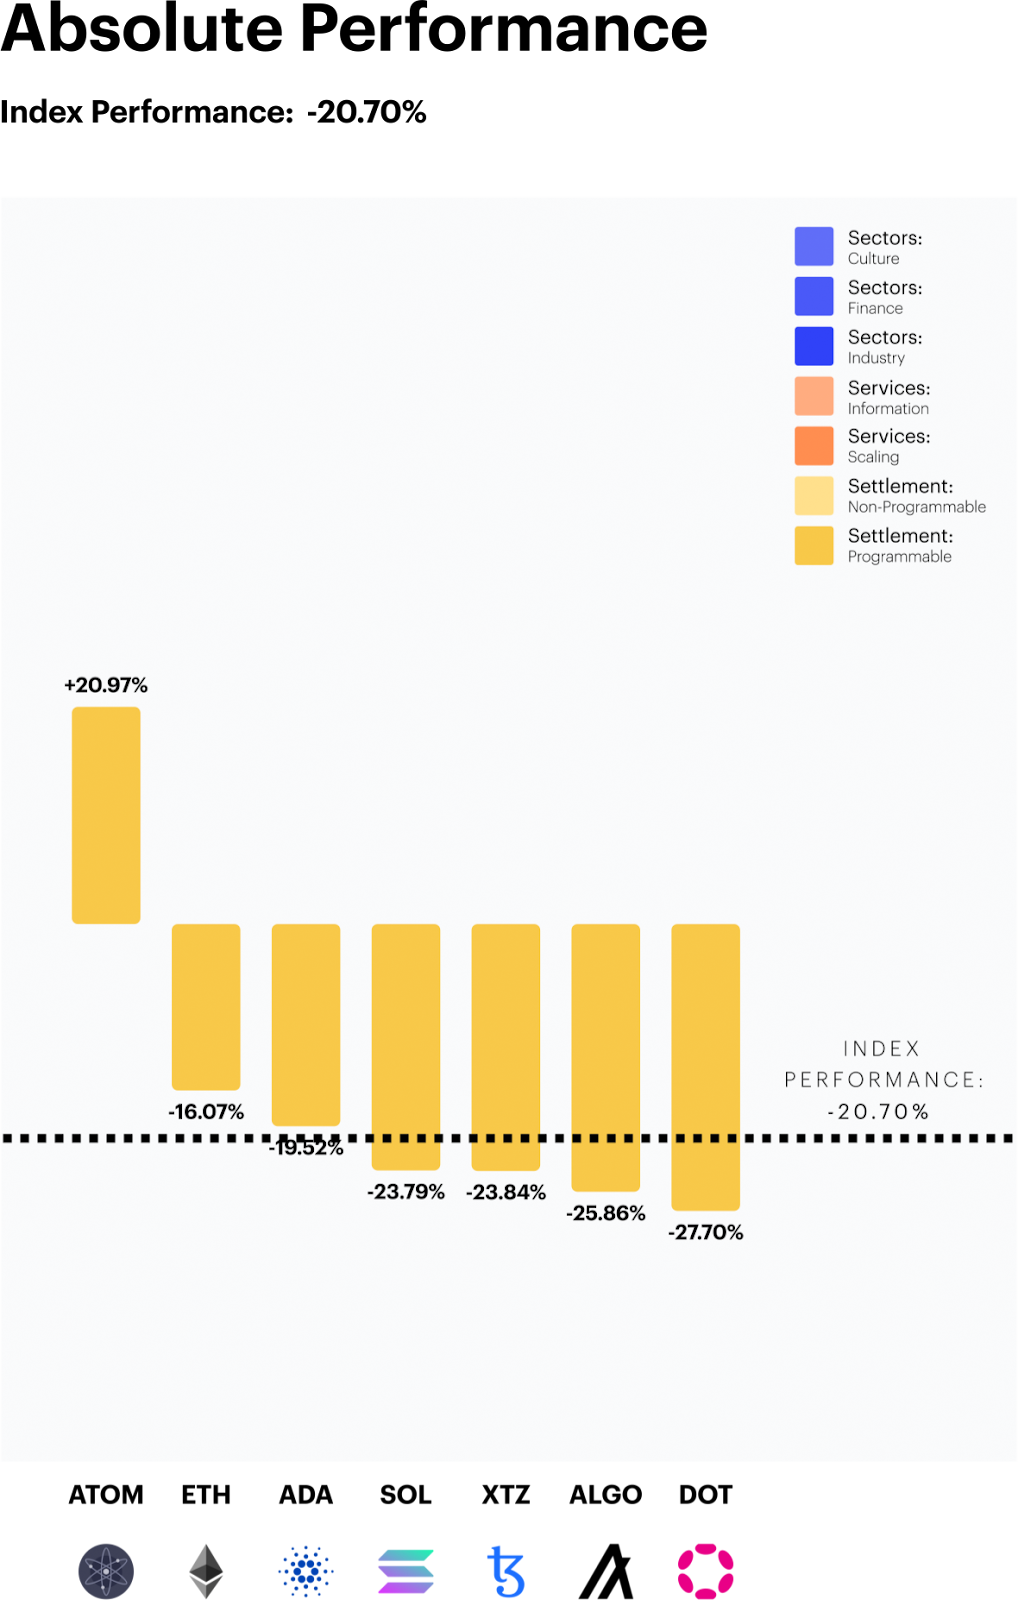
Performance Contribution was broadly negative in the Smart Contracts space. The headline index finished the rebalancing period down -20.7%, with the majority of the negative performance coming from SOL and ADA. ATOM was the sole token to finish in positive territory. However, its modest weight (~2%) led to only a minor positive index contribution.
Despite ETH’s top weighting in the index, the token contributed -3.6% to the index return (3rd overall) as the hype around its scheduled blockchain upgrade boosted sentiment.
ATOM’s Positive Momentum Intact
Cosmo’s native token, ATOM, provided a standout performance over its peer group, finishing the quarterly window up +20.9% and outperforming the parent index by over +40% in absolute terms. The ATOM protocol is commonly proclaimed to be “the Internet of Blockchains” due to its unique customizability and interoperability. ATOM’s price trend has been stable over the past few months, and overall price volatility is impressively lower than the parent index.
The runner up in absolute terms was ETH. Despite finishing in negative territory, investor sentiment has remained relatively more resilient as the Ethereum network continues to advance on its claims to switching its blockchain network from Proof-of-Work (PoW) to Proof-of-Stake (PoS). The highly anticipated change is set to deliver higher efficiency and bandwidth, which is believed to help bolster its competitive edge against Layer-2 blockchain solutions.
ETH Flippening Edging Closer
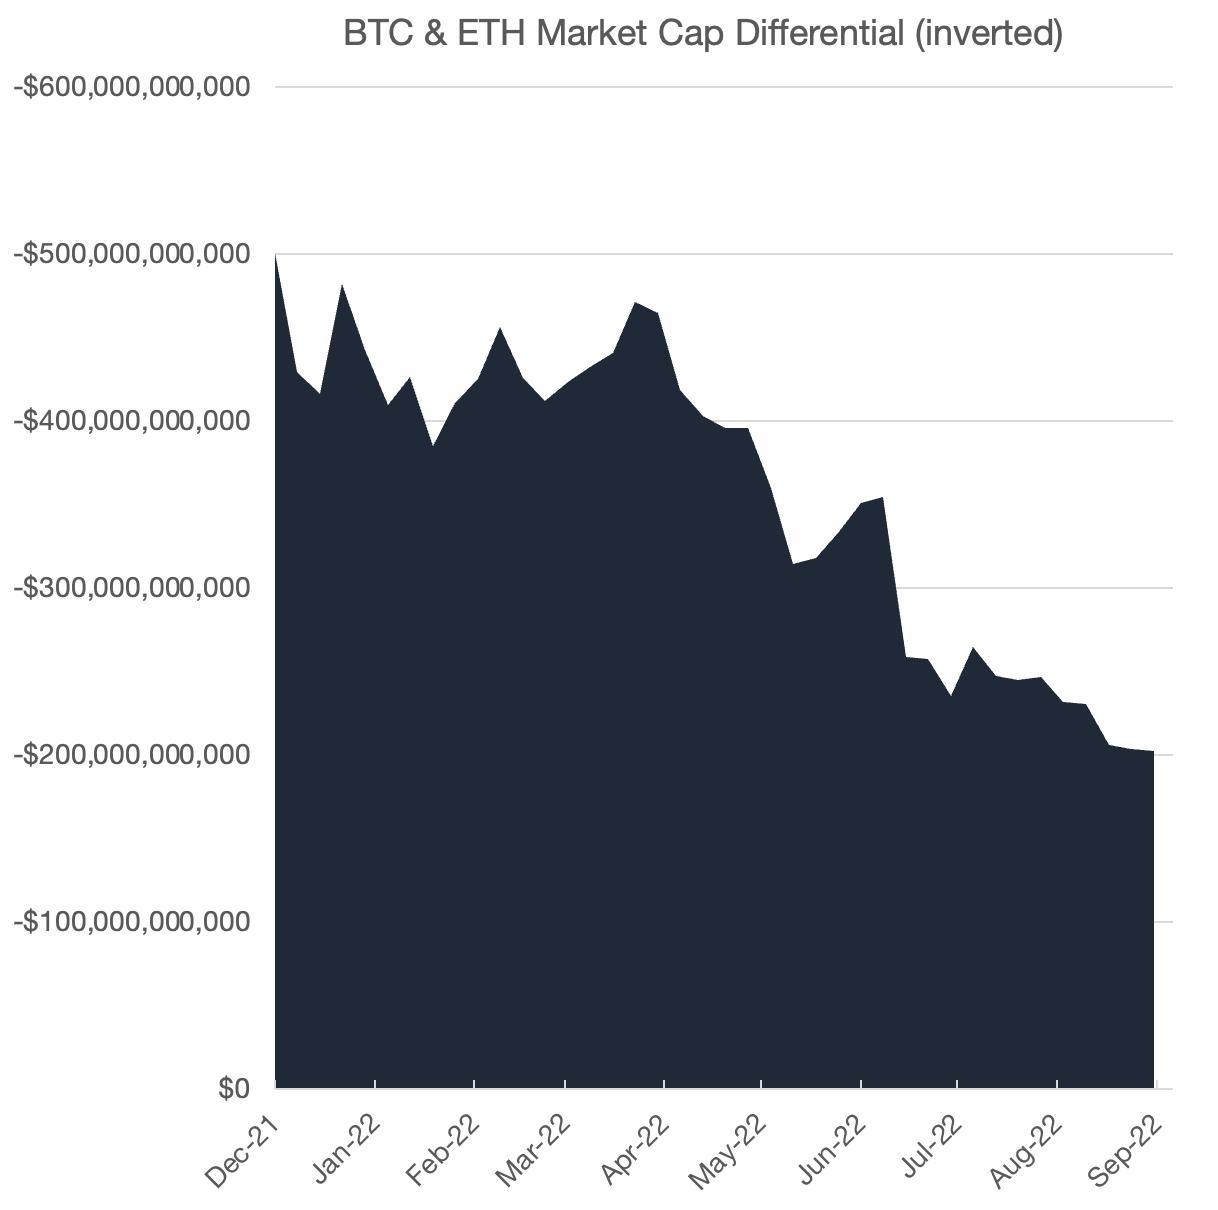
The term “Flippening” refers to the relative pricing momentum of the two largest crypto tokens, ETH and BTC. Cryptomarket enthusiasts are keen to speculate or predict that ETH will one day overtake BTC as the world’s largest token by market capitalization.
In the start of the year, the spread differential between BTC and ETH stood at approximately $500bn. This gap has narrowed considerably over last eight months, breaching $200bn for the first time in recent history. If the current trend persists, ETH could reach the top of the league tables by the end of 2023, or sooner.
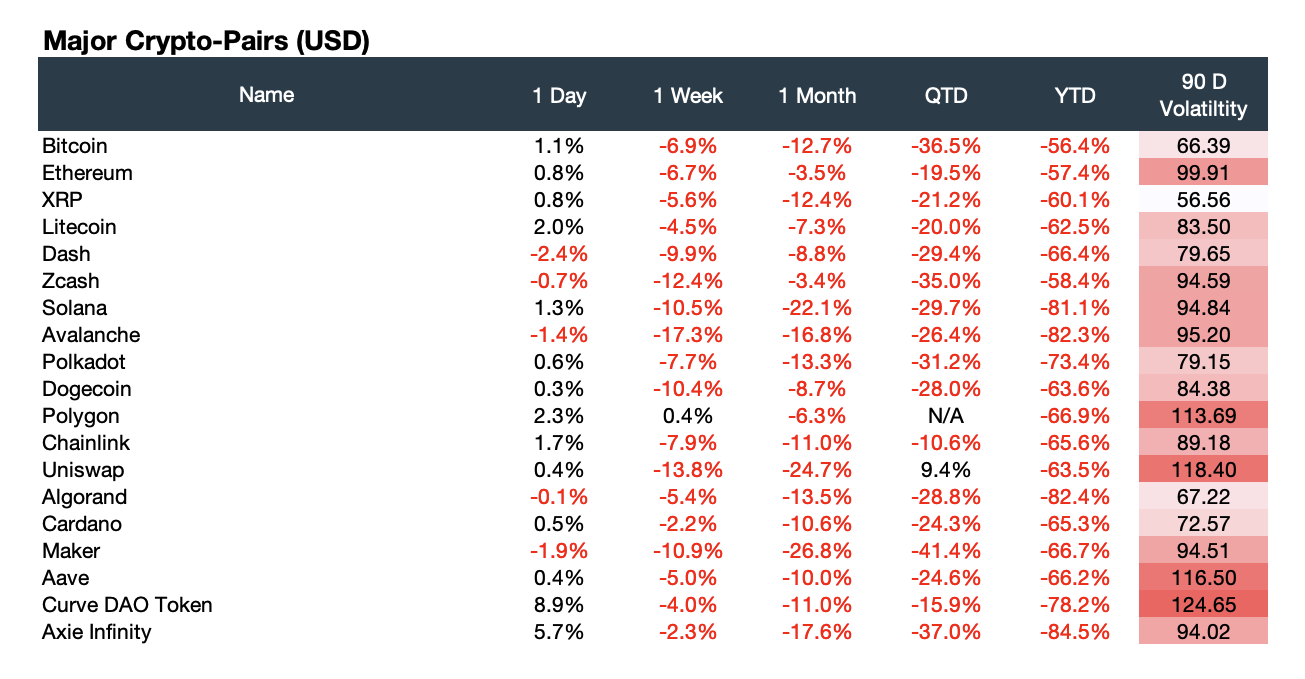
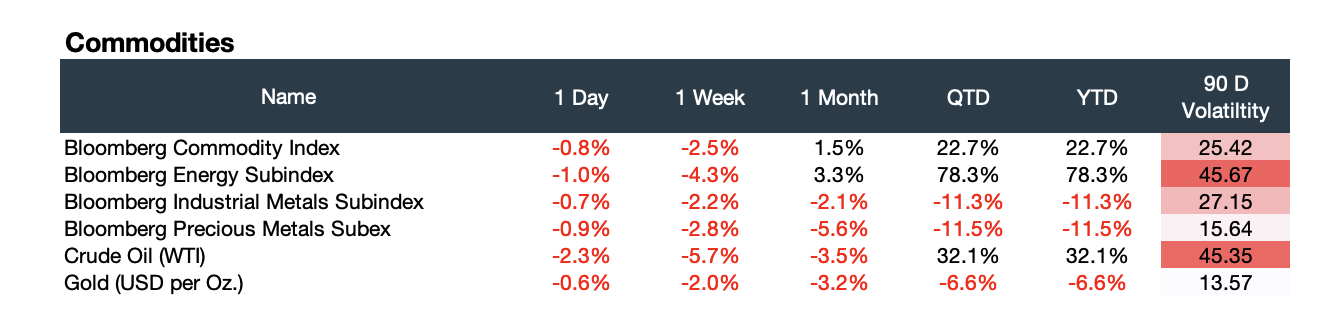
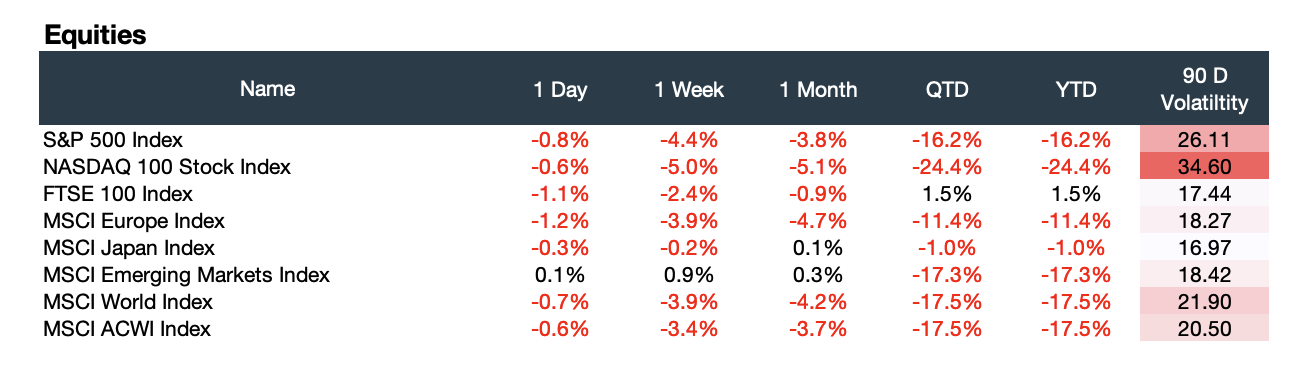
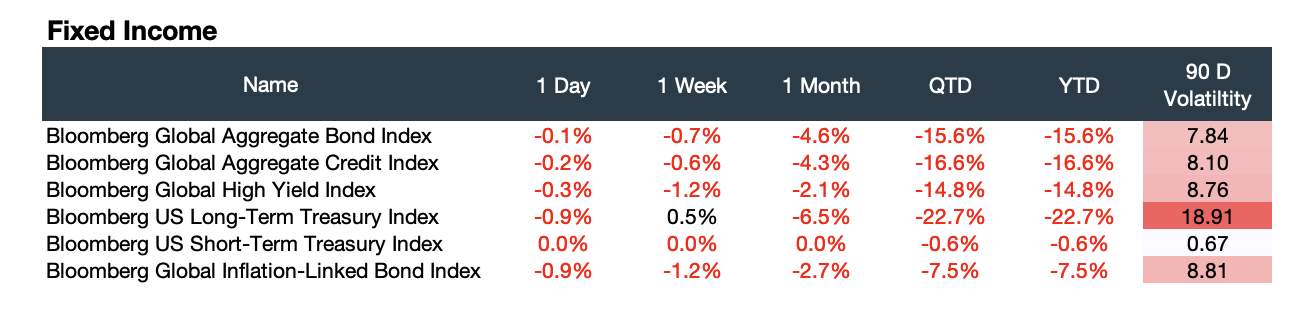
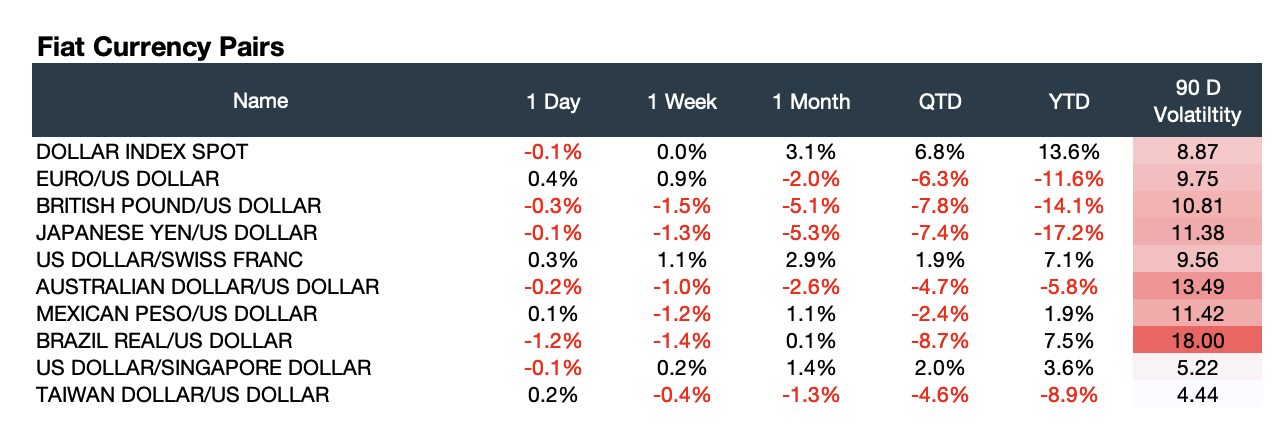
Appendix: Market Performance Overview
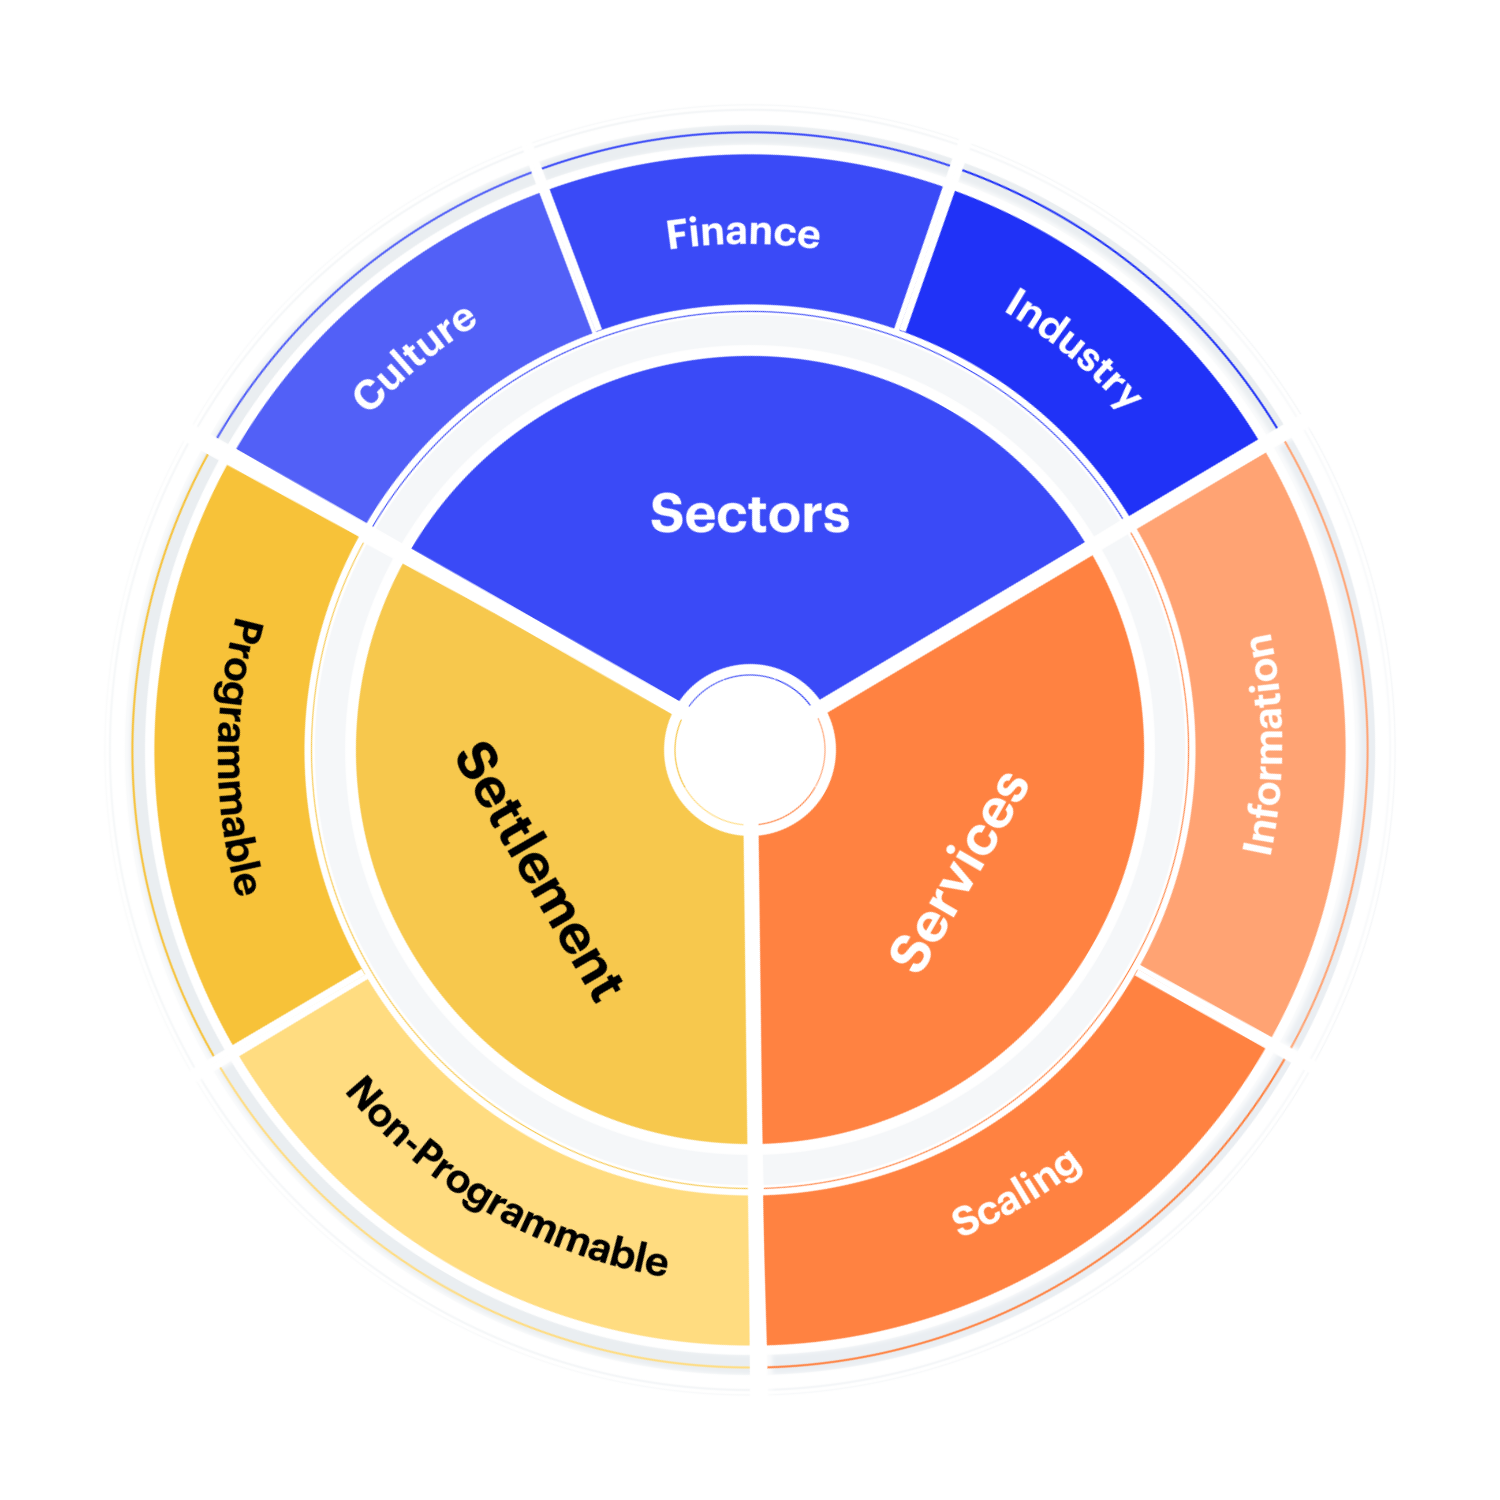
Appendix: CF Digital Asset Classification Structure
The CF Digital Asset Classification Structure (DACS) classifies coins and tokens based on the services that the associated software protocol delivers to end users, grouping assets by the role they play in delivering services to end users. The CF DACS powers CF Benchmarks' sector composite and category portfolio indices and allows users to perform attribution analysis to better understand the fundamental drivers of returns within their digital asset portfolios.
Additional Resources
For more information about our CF Benchmark indices and our methodologies, please visit the respective web links below:
- CF Diversified Large Cap Index
- CF DeFi Composite Index
- CF Web 3.0 Smart Contract Platforms Index
- CF Digital Culture Composite Index
- CF Blockchain Infrastructure Index
- CF Cryptocurrency Ultra Cap 5 Index
The information contained within is for educational and informational purposes ONLY. It is not intended nor should it be considered an invitation or inducement to buy or sell any of the underlying instruments cited including but not limited to cryptoassets, financial instruments or any instruments that reference any index provided by CF Benchmarks Ltd. This communication is not intended to persuade or incite you to buy or sell security or securities noted within. Any commentary provided is the opinion of the author and should not be considered a personalised recommendation. Please contact your financial adviser or professional before making an investment decision.