
Momentum Outperforms Following New Highs

Key takeaways:
Rotation Toward Risk Dominates Factor Returns
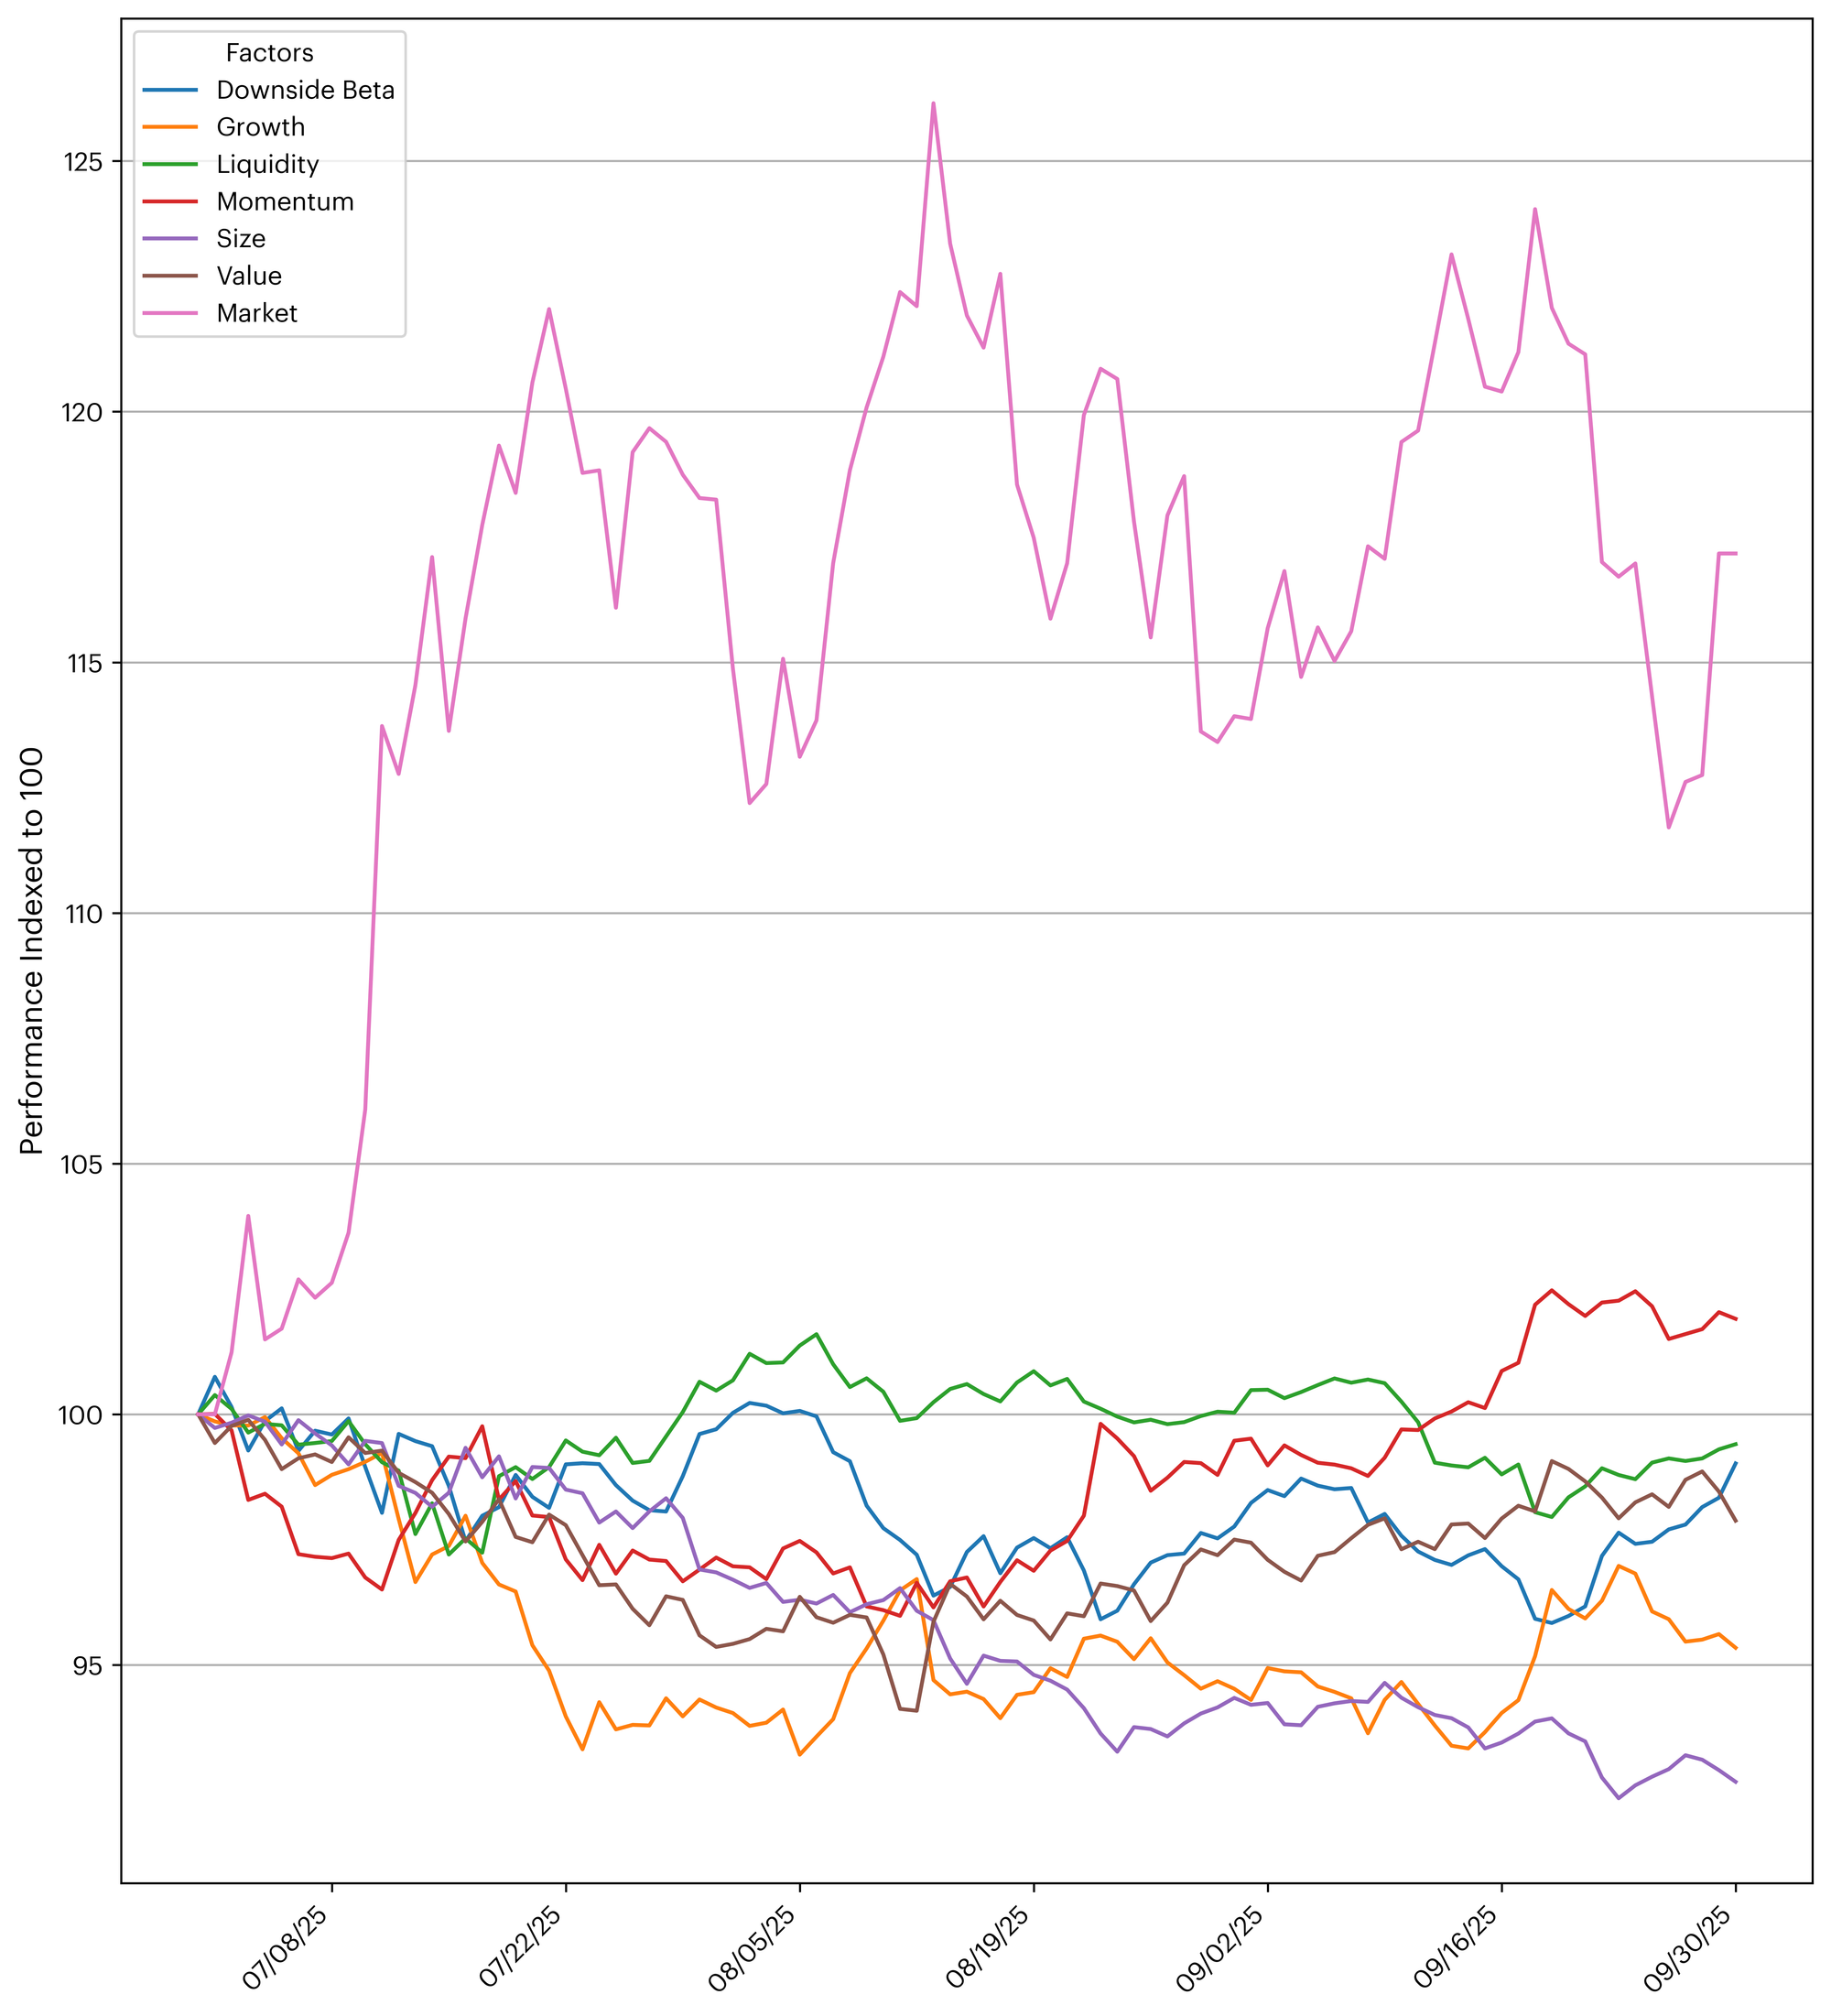
Q3 2025 extended the digital asset market’s rebound. The CF Broad Cap Index advanced 16.1%, driven by renewed momentum in large-cap assets. Momentum led factor returns (+1.9%), highlighting the continued strength of trend-following strategies amid mixed market signals. In contrast, Size (–7.3%) and Growth (–4.7%) declined as smaller-cap and high-expansion tokens lagged. Value (–2.1%) and Liquidity (–0.6%) also softened, while Downside Beta (–1.0%) underperformed as mid-quarter rallies reduced the premium on defensiveness. Overall, Q3 reflected a more selective phase of recovery, with investors emphasizing large-cap tokens and sustained momentum over broad risk exposure.
Momentum, Size, and Value Drive Long-Side Gains in Q2
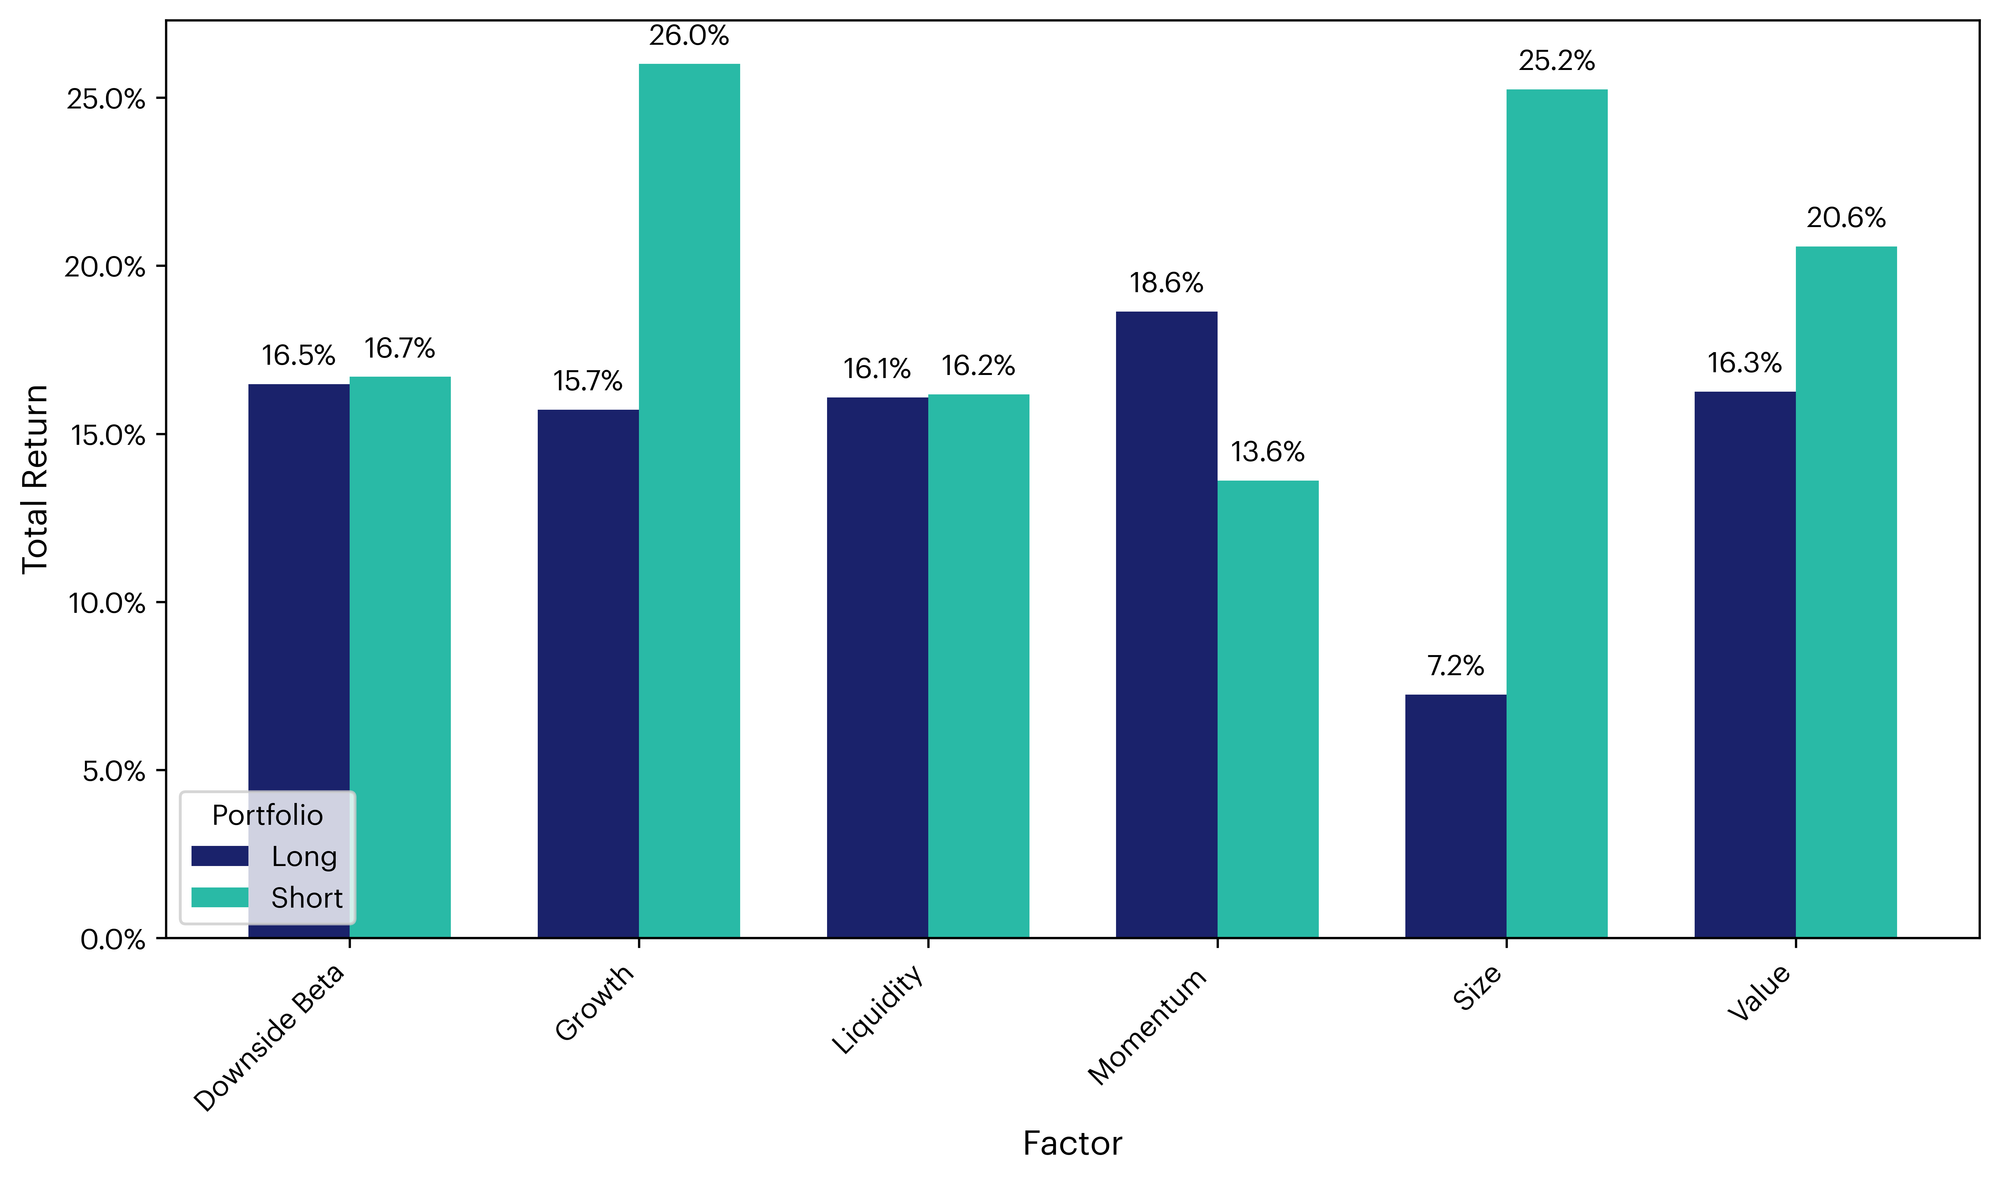
In the third quarter of 2025, Momentum stood out as the best performer on the long side, followed by Value and Downside Beta. On the short side, Growth and Size delivered the strongest results, with Value ranking third. The Q3 factor profile points to a more selective advance: investors were rewarded for trend exposure, while small-cap bias and value tilts detracted at the portfolio level, and defensive exposures (such as Downside Beta and less liquid tokens) acted as a modest drag on performance.
The CF Settlement Category Index Offers More Than Market Exposure
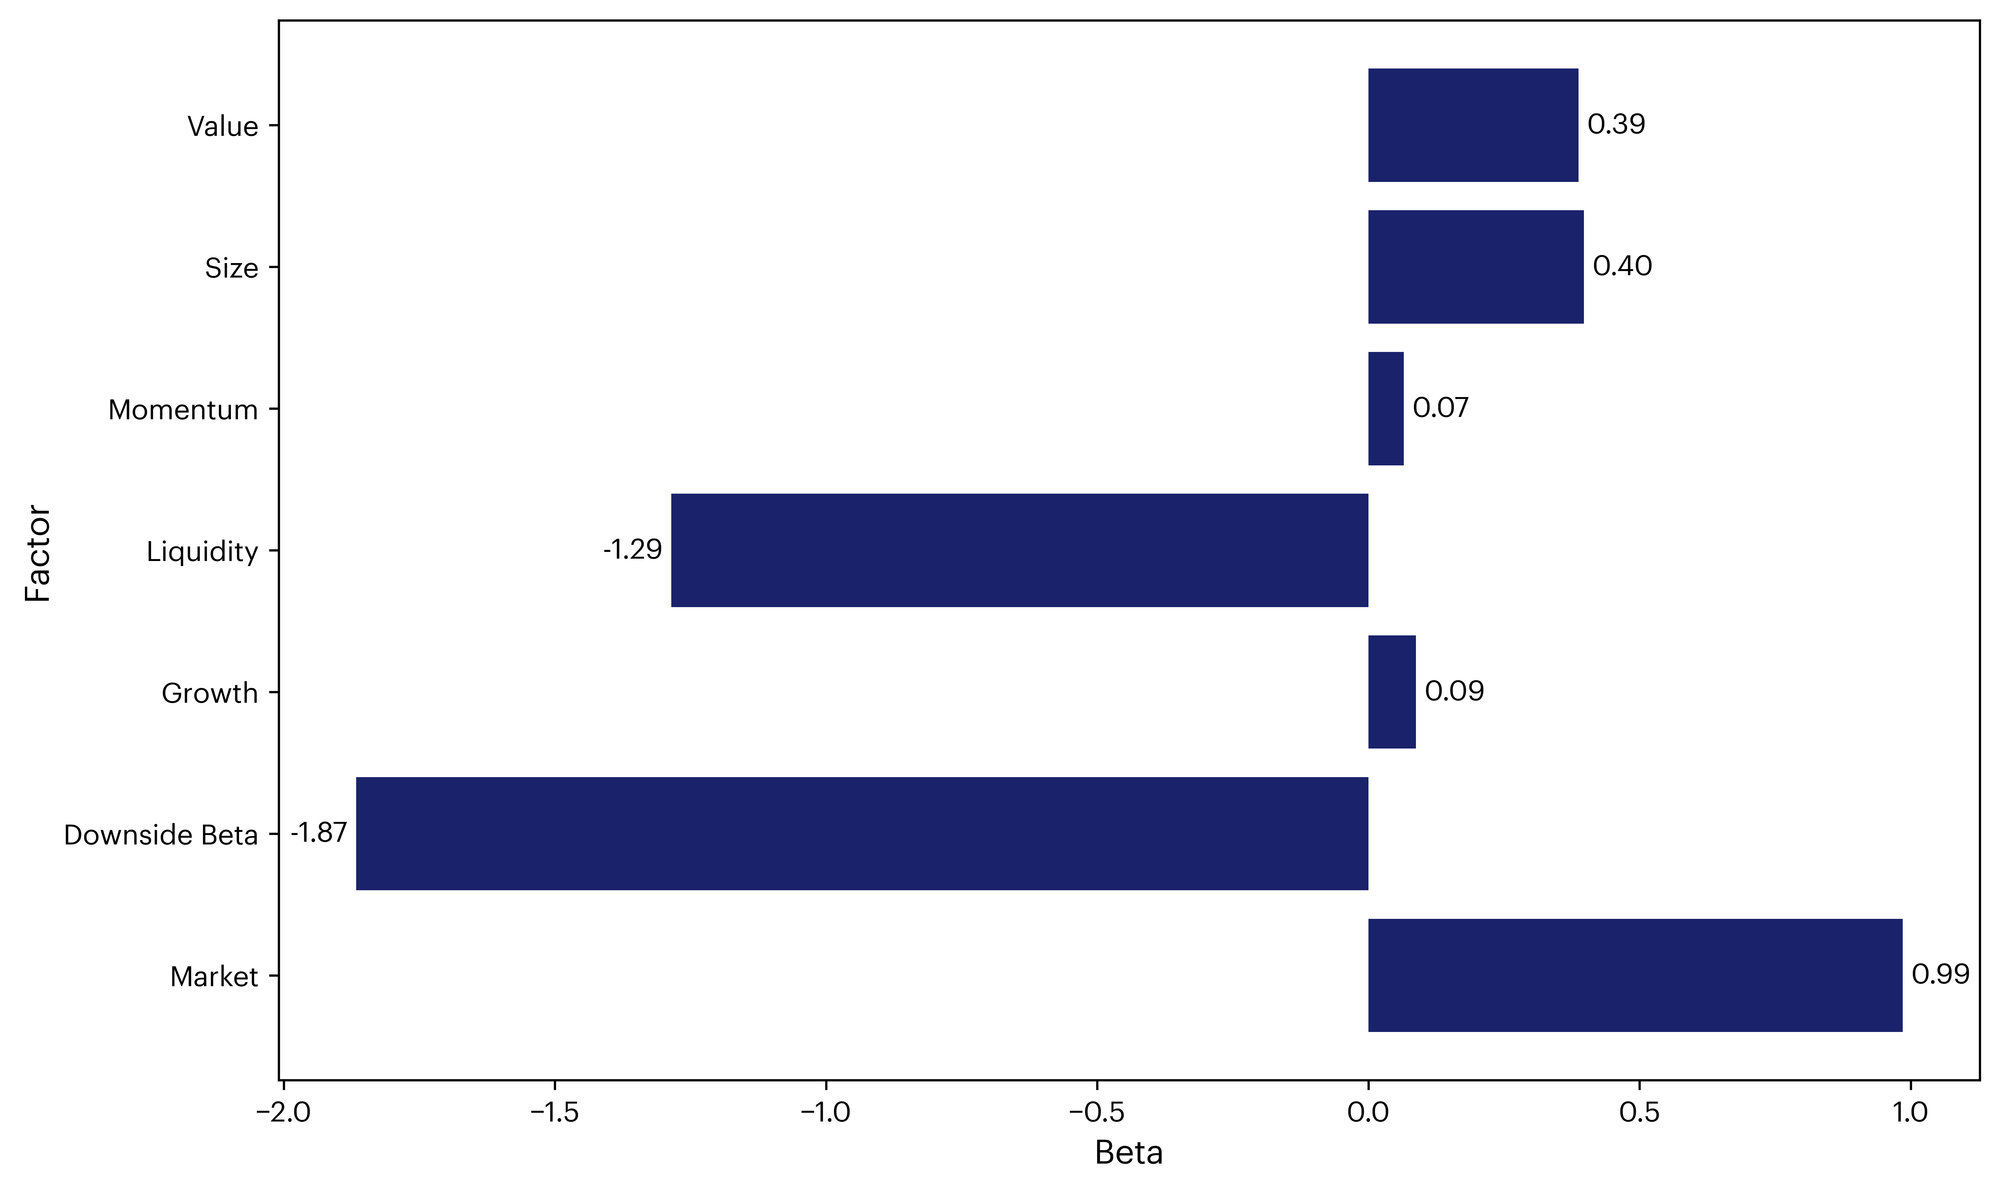
The CF Settlement Category Index's factor beta profile shows meaningful tilts beyond pure market exposure. The index exhibits strong negative sensitivity to Downside Beta (–1.87) and Liquidity (–1.29), indicating that it moves with more liquid tokens. Conversely, Size (+0.40) and Value (+0.39) show moderately positive tilts, reflecting its exposure to small-cap assets and tokens with efficient on-chain metrics. Growth (+0.09) and Momentum (+0.07) remain near neutral, suggesting limited correlation to trend following tokens and onchain activity. Overall, the Settlement Category Index maintains a defensive posture, with modest value and small-cap exposures providing partial balance.
The CF Services Category Index Tilts Towards Small-Cap & Value
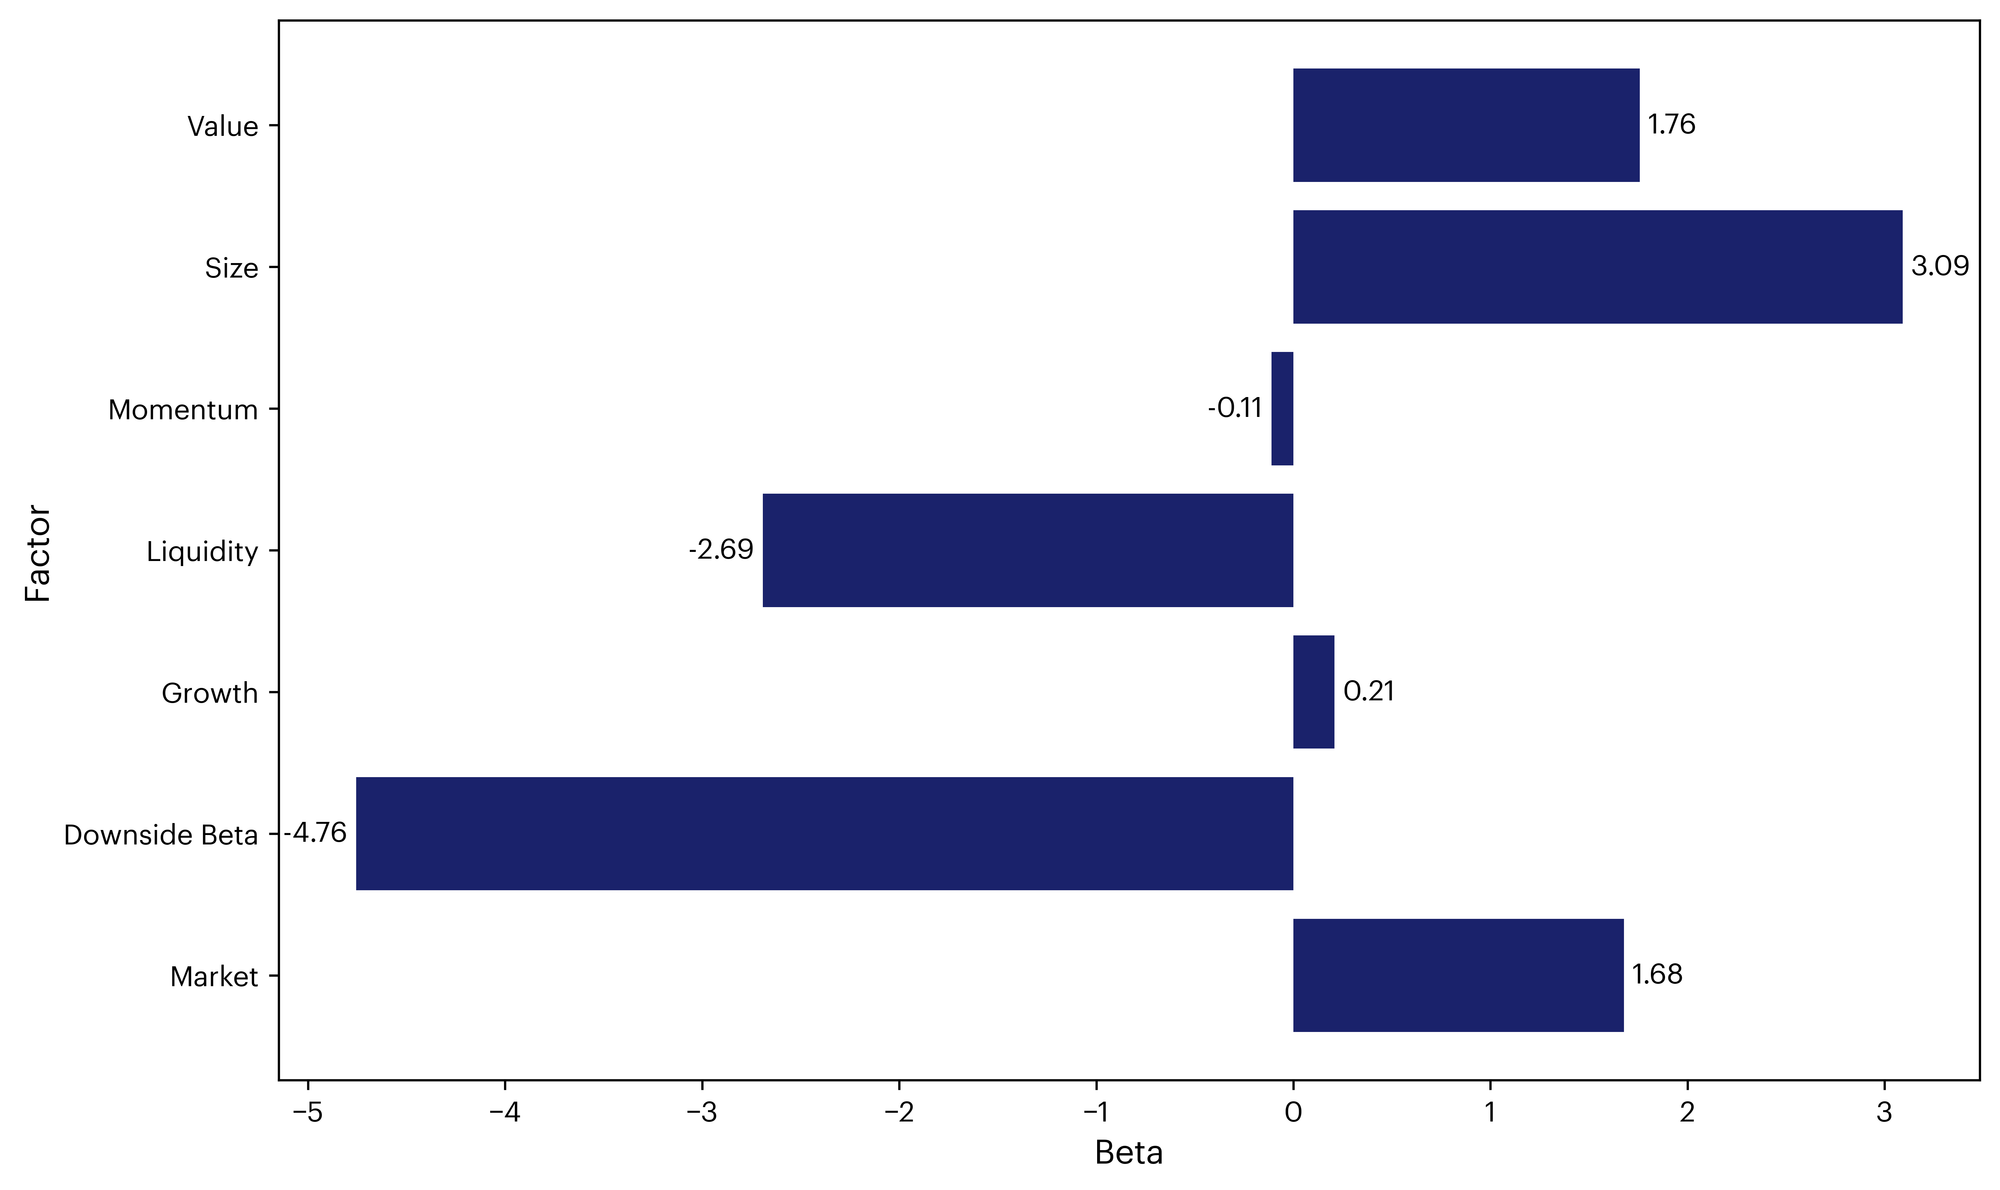
The CF Services Category Index exhibits a nuanced factor beta footprint. The profile is dominated by a very negative Downside Beta (–4.76) and negative Liquidity (–2.69), indicating a tilt toward risk-on and more liquid names. Offsetting this, the index shows a strong positive Size beta (+3.09) and a meaningful Value tilt (+1.76), suggesting performance has been driven by smaller-cap tokens and those with higher fee efficiency. Growth has a modestly positive beta (+0.21), while Momentum is slightly negative (–0.11), implying limited dependence on trend factors. Overall, the Services Category Index is characterized by a bias toward liquid, smaller-cap exposures with clear value orientation—a combination that enhances upside potential in constructive markets but heightens vulnerability during risk-off periods.
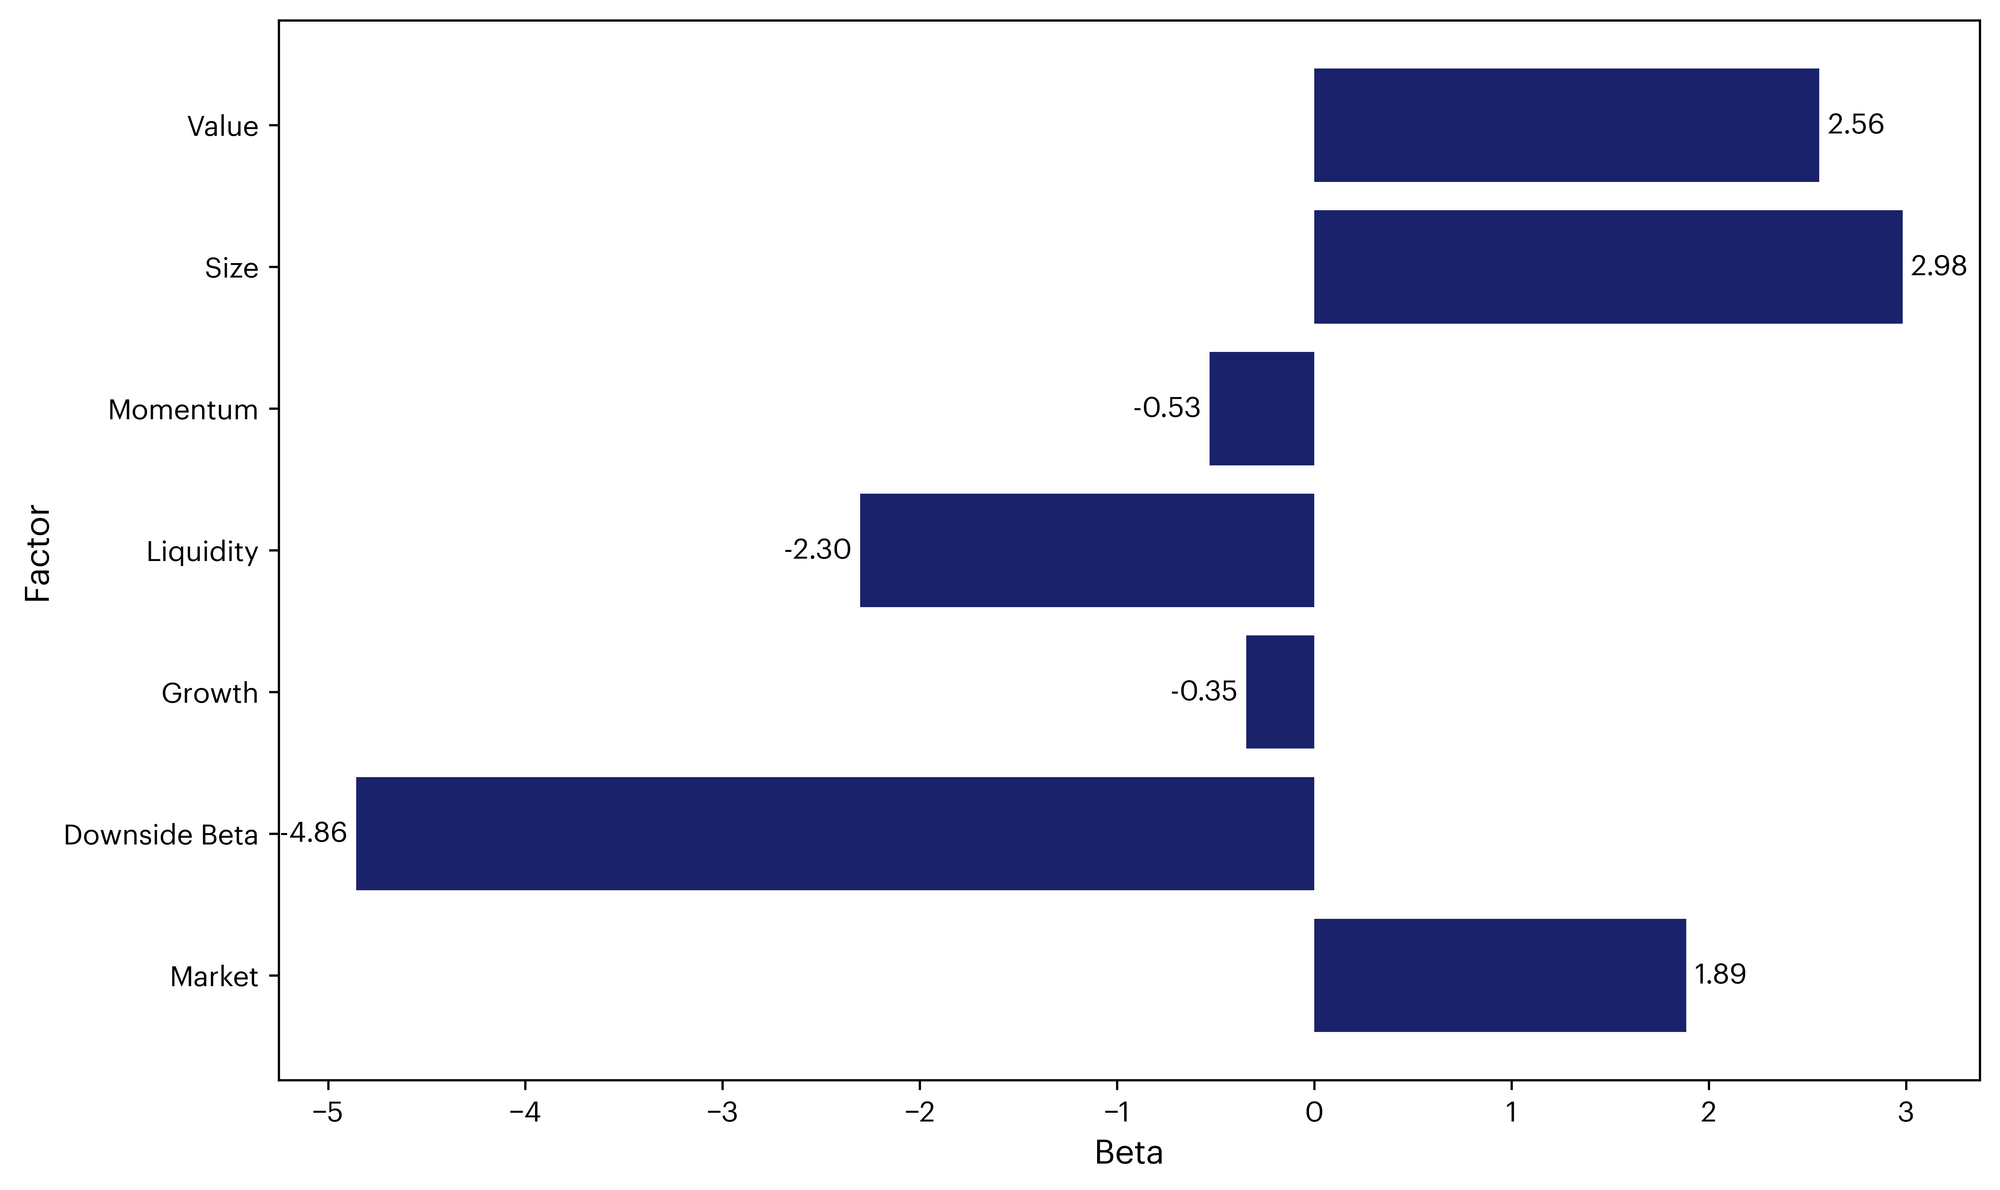
CF Sector Index Tilts Also Toward Small-Cap & Value
The CF Sectors Category Index displays a distinctive factor beta profile. The footprint is dominated by a very negative Downside Beta (–4.86) and negative Liquidity beta (–2.30), indicating elevated sensitivity to risk-off episodes and a tilt toward more liquid names. Offsetting this, the index shows a strong positive Size beta (+2.98) and a meaningful Value tilt (+2.56), suggesting exposure to smaller-cap tokens with more established or efficient network fundamentals. Growth is modestly negative (–0.35) and Momentum slightly negative (–0.53), reflecting limited participation in tokens driven by rapid network expansion or short-term price trends. Overall, the Sectors Category Index leans toward liquid, smaller-cap value exposures with pronounced downside sensitivity—a combination that can amplify upside participation in favorable markets but increases vulnerability during periods of risk aversion.
To read the complete report, kindly click on the provided link (or click here to view a PDF version). Additionally, please do not forget to subscribe to our latest news and research for the most relevant institutional insights on digital assets and the top digital assets by market cap.
The information contained within is for educational and informational purposes ONLY. It is not intended nor should it be considered an invitation or inducement to buy or sell any of the underlying instruments cited including but not limited to cryptoassets, financial instruments or any instruments that reference any index provided by CF Benchmarks Ltd. This communication is not intended to persuade or incite you to buy or sell security or securities noted within. Any commentary provided is the opinion of the author and should not be considered a personalised recommendation. Please contact your financial adviser or professional before making an investment decision.