
Value and Momentum Outperform in Q2 Rally
The CF Benchmarks' Factor Report applies a robust multi-factor model to digital assets, enabling investors to track key drivers of crypto returns (Market, Size, Value, Momentum, Growth, Downside Beta, and Liquidity) and understand how these factors evolve across different market regimes.

Key takeaways:
Rotation Toward Risk Dominates Factor Returns
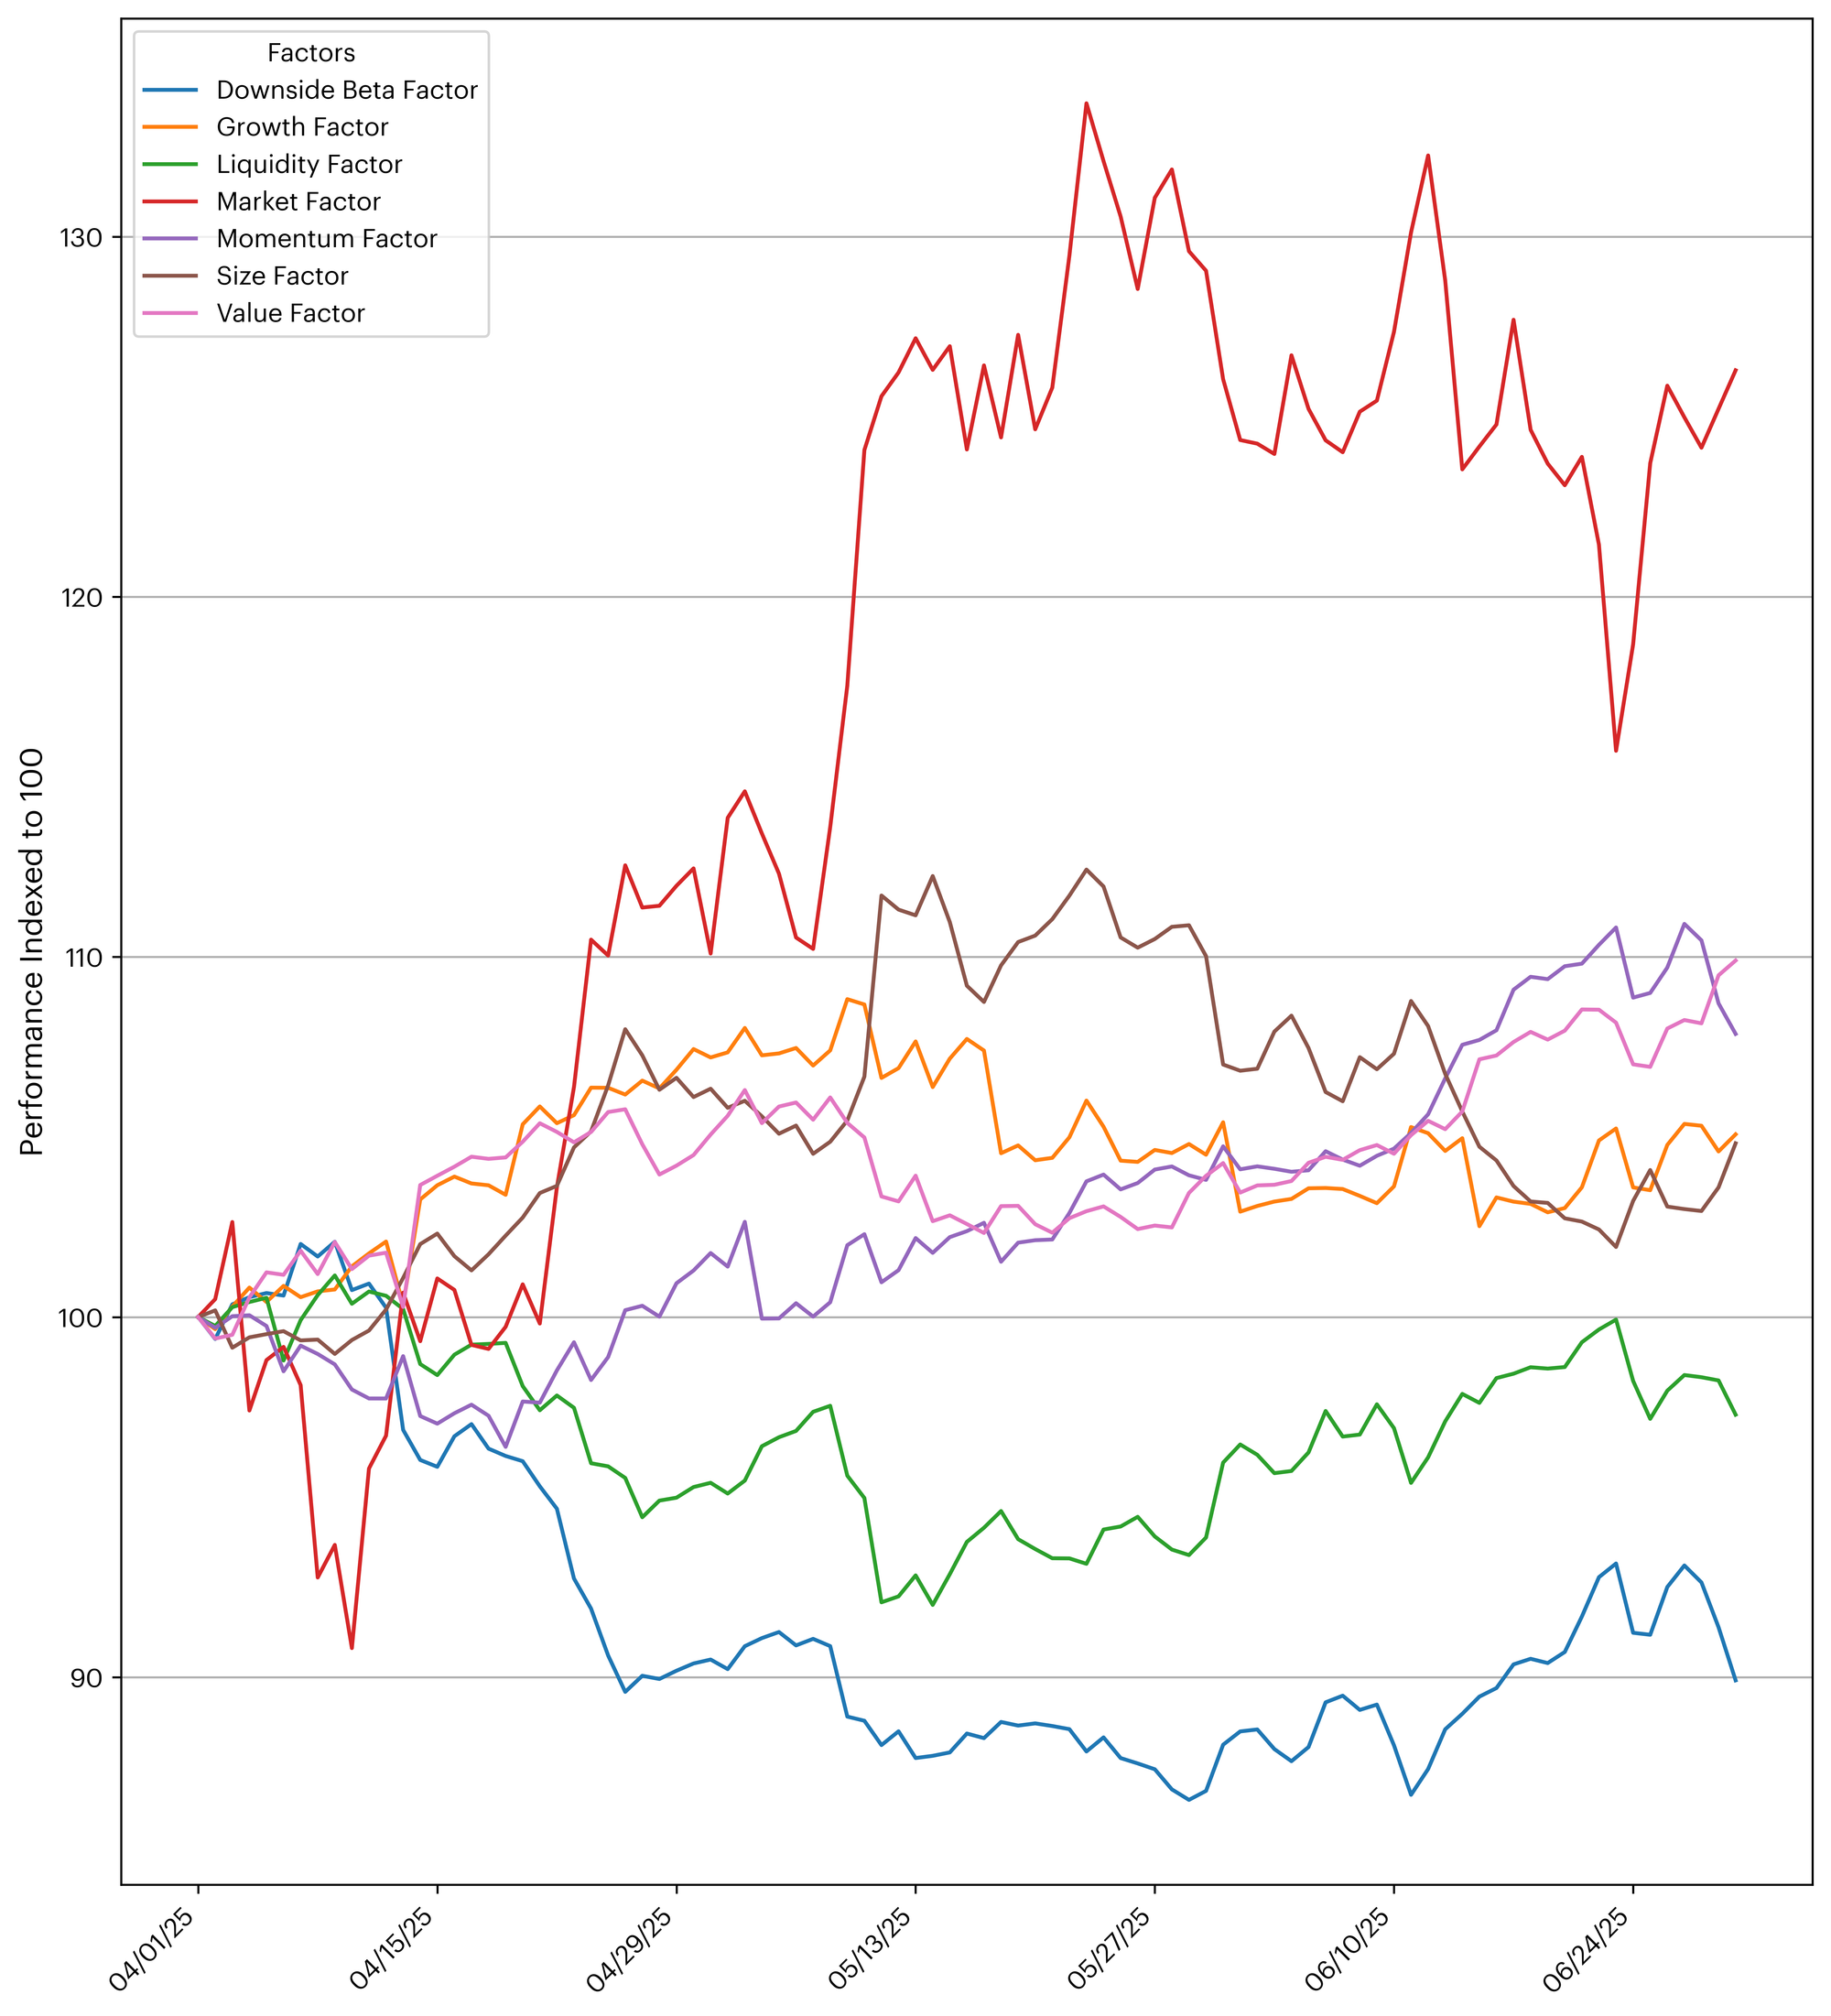
Q2 2025 saw a significant shift into digital assets, with the Market factor surging 27% to reverse Q1 losses. Investors favored small-cap tokens and protocols with higher user engagement and TVL relative to their market caps (Size +4.4%, Value +10.4%), while Momentum (+8.5%) and Growth (+5.2%) also delivered. Liquid tokens outperformed (Liquidity –2.0%), and defensive positioning lost ground (Downside Beta –9.9%).
Momentum, Size, and Value Drive Long-Side Gains in Q2
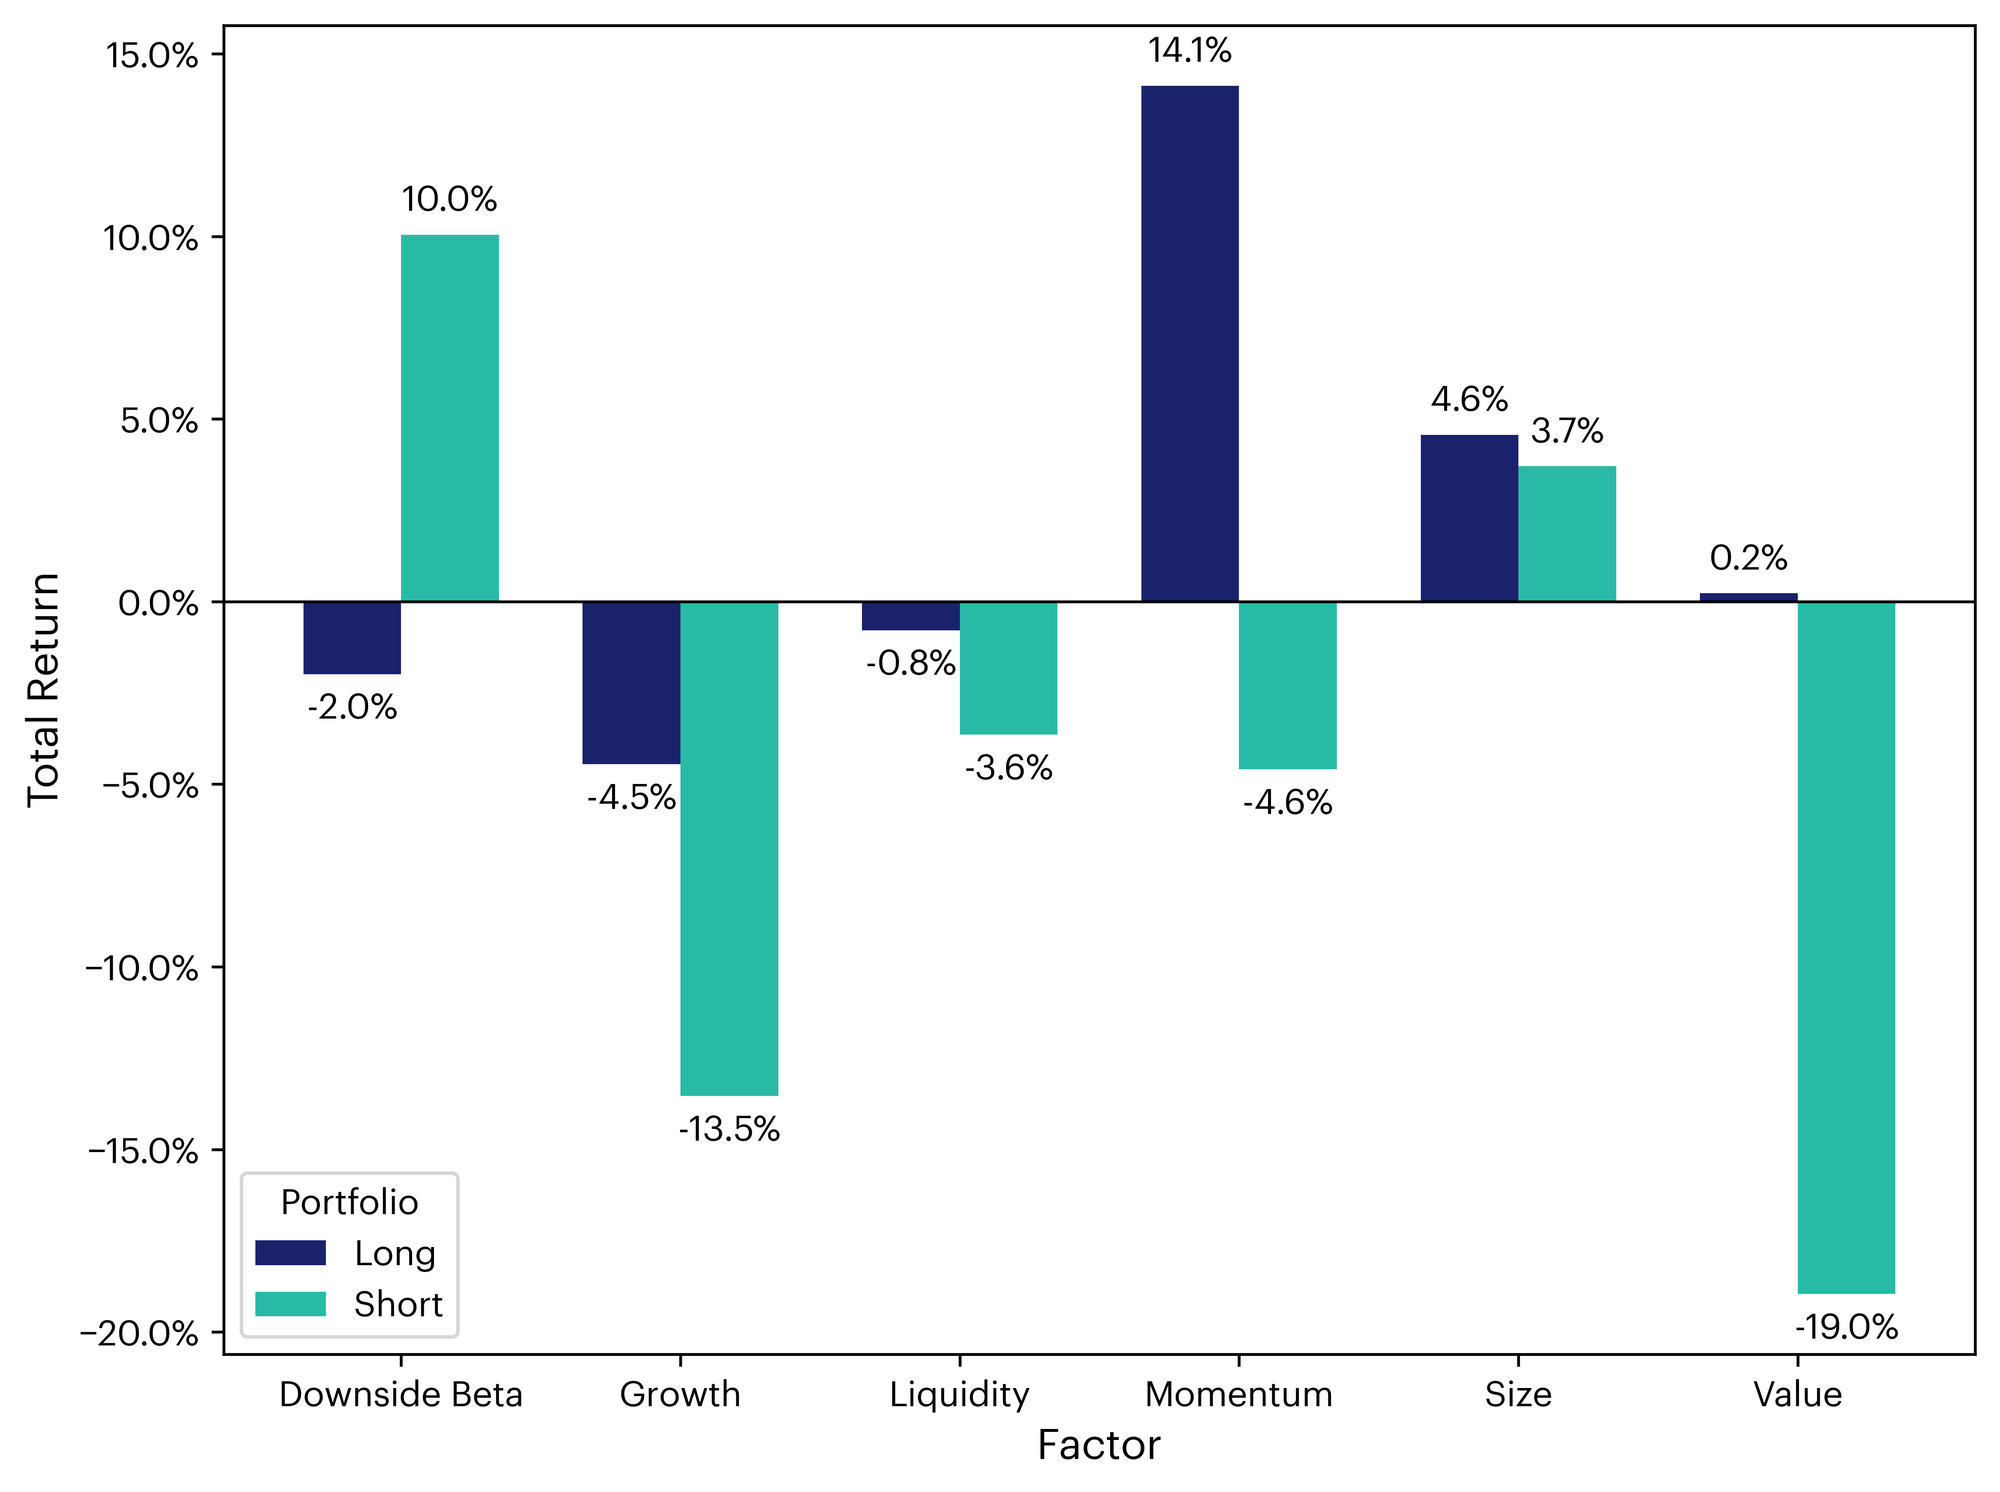
In the second quarter of 2025, Momentum stood out as the best performer on the long side, followed by Size and Value. On the short side, Value and Growth delivered the strongest results, with Momentum ranking third. The Q2 factor performance signals the early stages of a more durable market rally. Investors were rewarded for positioning in tokens with strong network fundamentals and price momentum, while defensive exposures (such as Downside Beta and more Illiquid tokens) acted as a drag on performance.
The Market Factor drove the CF Settlement Category's Returns
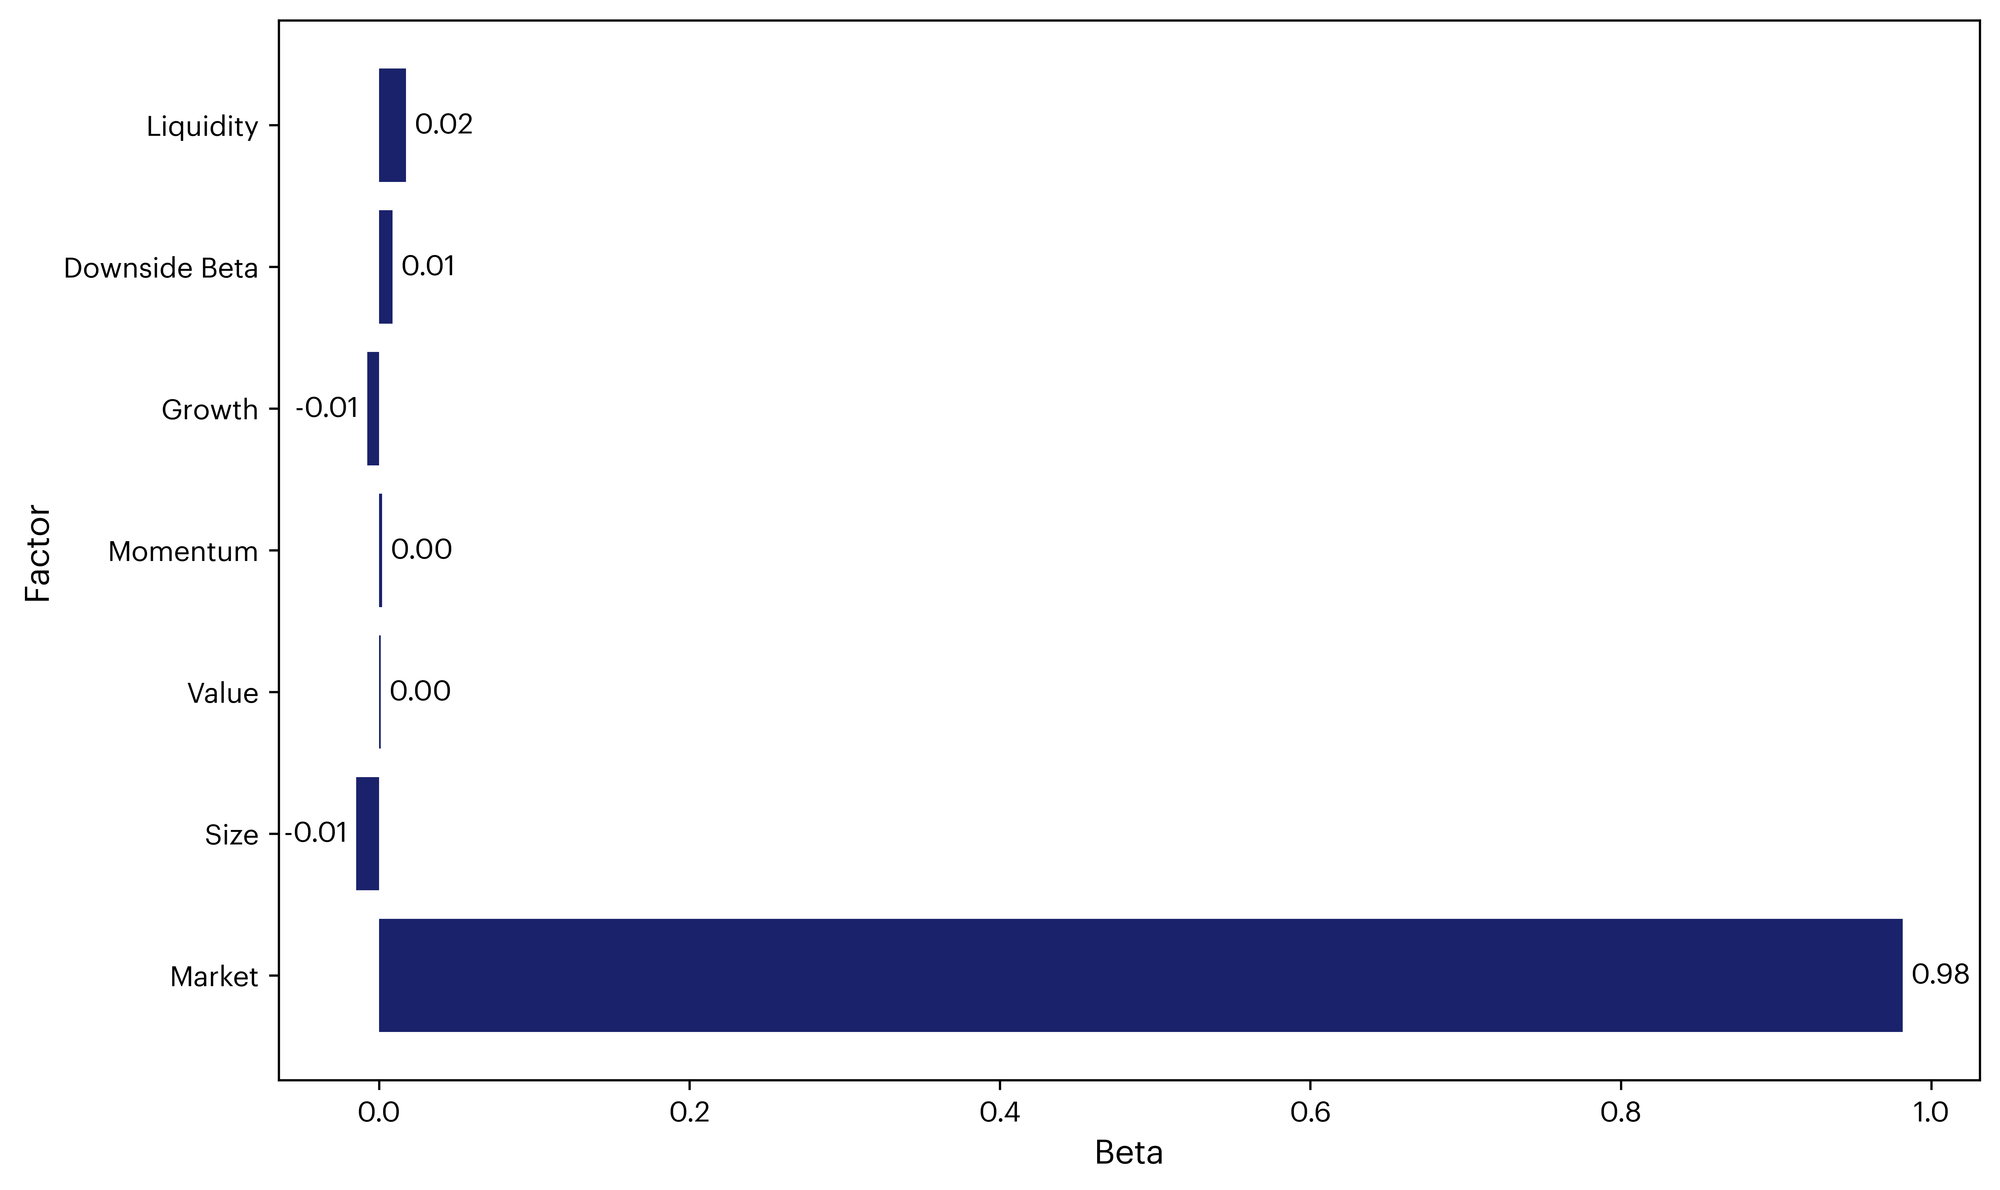
The CF Settlement Category Index displays a straightforward factor beta profile, essentially a one-factor story. Its market factor beta of 0.98 directly reflects Bitcoin's commanding 76.9% weight in the category. Given that Bitcoin comprises roughly three-quarters of the CF Broad Cap Index, the index moves nearly point-for-point with the market factor. All other factor betas remain negligible: size (–0.02), liquidity (+0.02), downside (+0.01), momentum (+0.00), value (+0.00), and growth (–0.01). These near-zero exposures confirm the index has no meaningful tilts toward alternative factors, creating a clean investment vehicle driven almost entirely by Bitcoin's market influence.
The CF Services Category Index Tilts Towards Small-Cap & Value
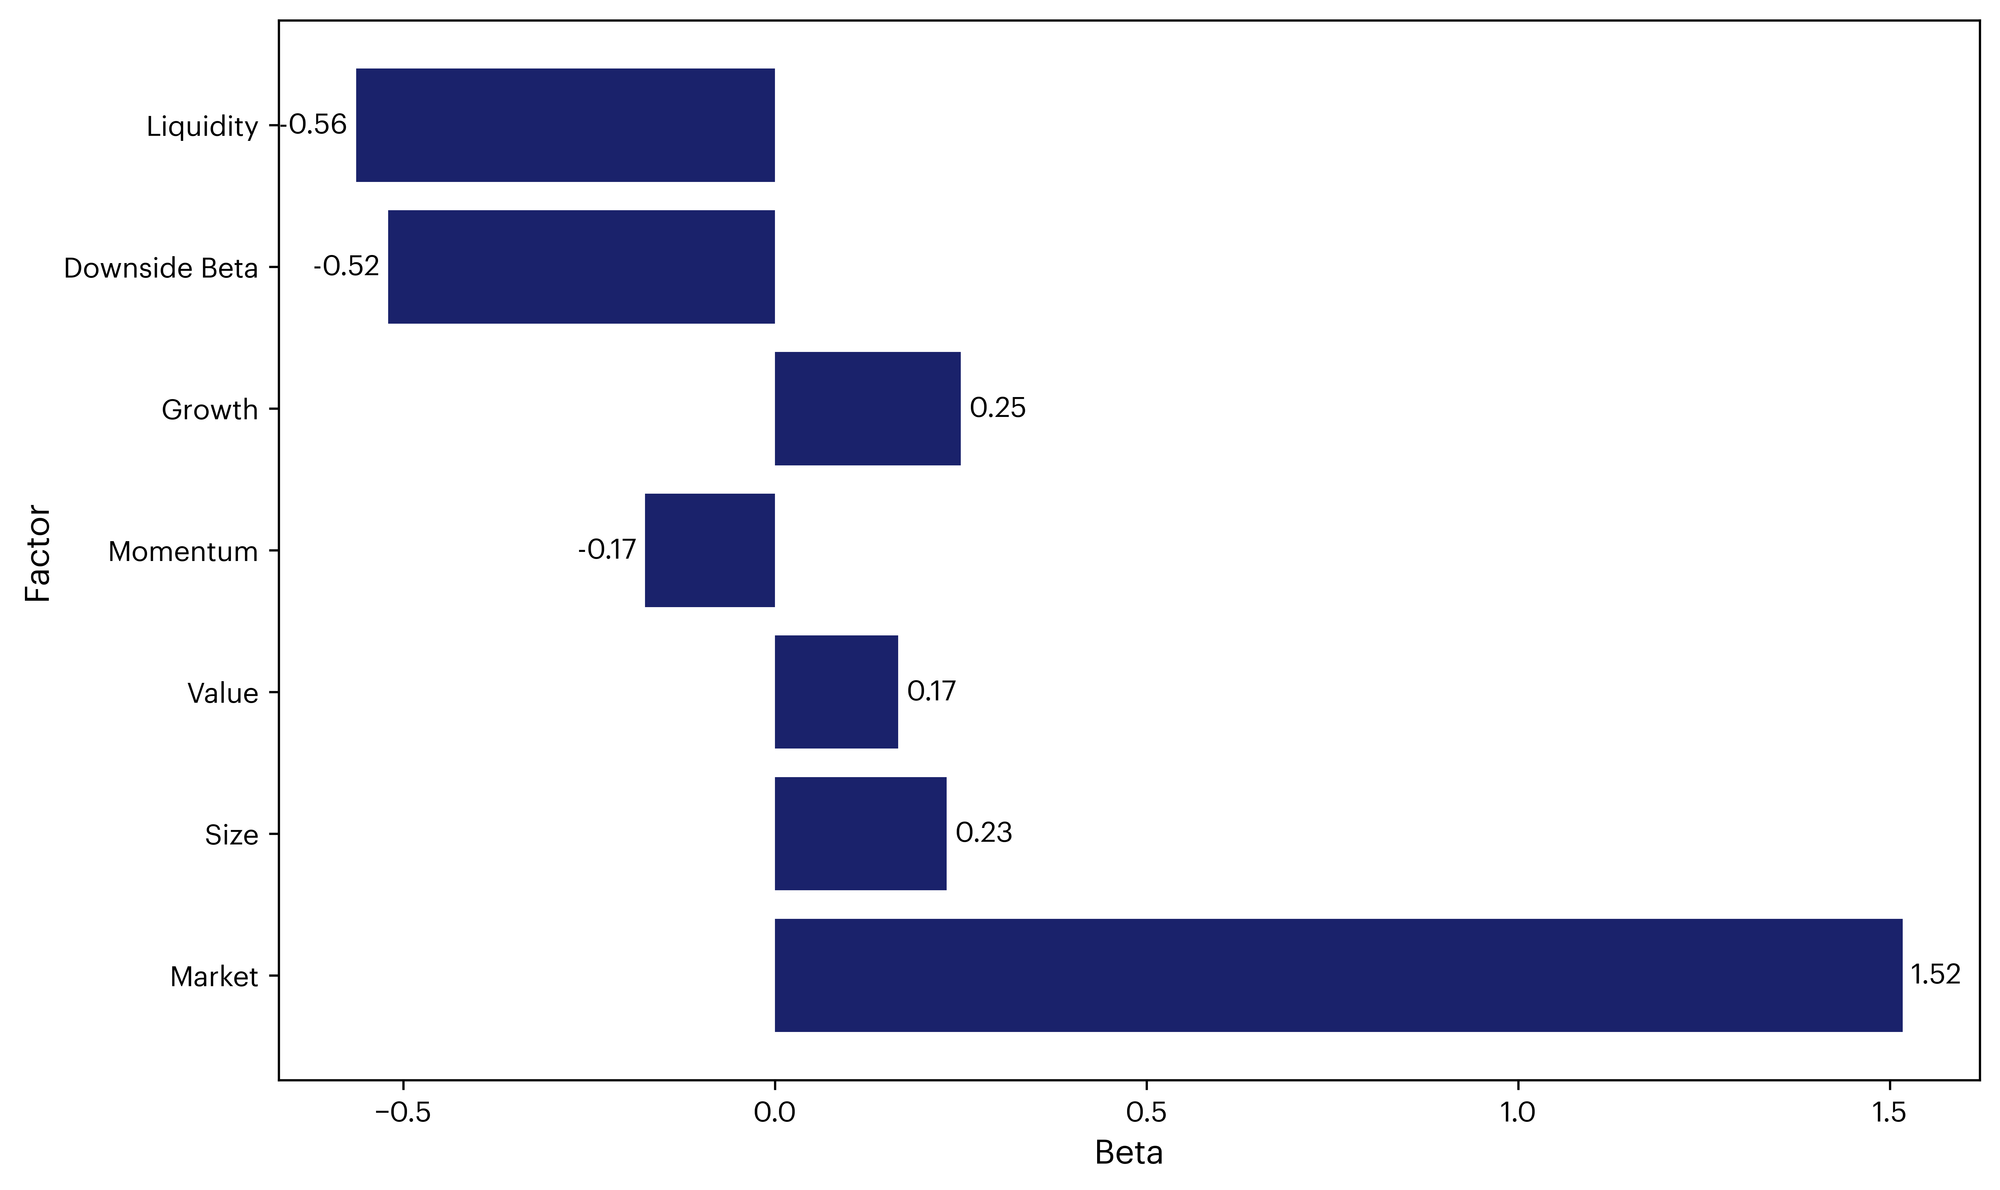
The CF Services Category Index exhibits a nuanced factor beta footprint. Its market beta of 1.52 implies that the basket amplifies broad-market swings. A positive size beta (+0.23) reflects greater relative exposure to smaller-cap assets, highlighting the index’s tilt toward more agile, potentially high-growth tokens. The growth beta of +0.25 further supports this view, suggesting a preference for assets with relatively strong growth characteristics. The index also displays pronounced risk-seeking qualities, with negative downside beta (–0.52) while the liquidity beta of –0.56 points to a meaningful bias toward more liquid assets, possibly positioning the index for quicker responsiveness during periods of market stress. By contrast, exposure to momentum and value appears limited, suggesting these factors play a less pronounced role in the index’s risk profile.
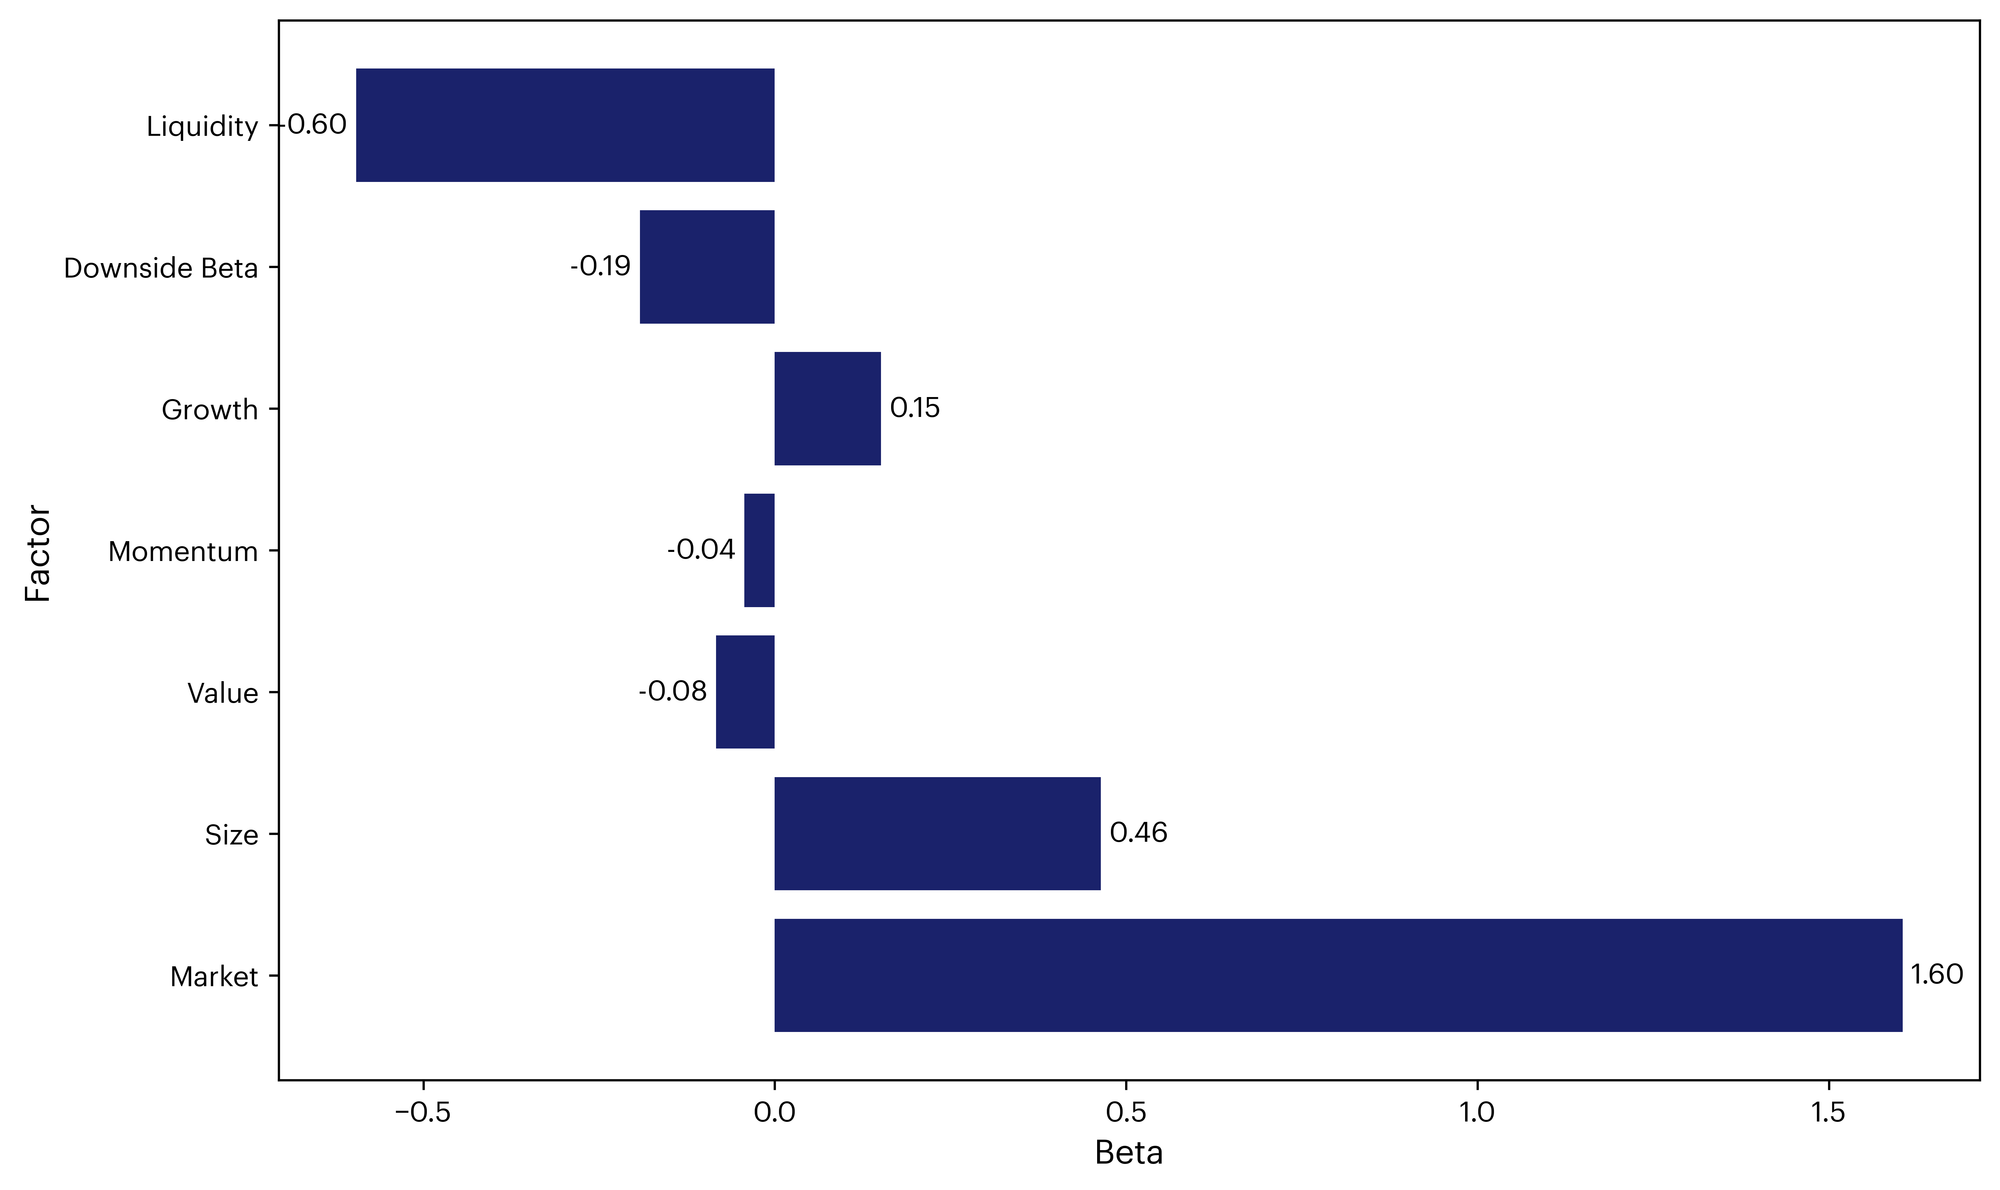
CF Sector Index Tilts Toward Small-Cap and Liquid Tokens
The Sector Category Index shows a pronounced sensitivity to market-wide movements, with a market beta of 1.60 indicating that it tends to amplify broad-market swings. A size beta of +0.46 suggests a meaningful tilt toward smaller-cap assets, pointing to greater exposure to tokens with potentially higher growth or volatility profiles. On the liquidity front, a liquidity beta of –0.60 reflects a strong preference for more liquid assets, which may enhance tradability and reduce transaction costs, particularly in volatile market environments. Exposure to other systematic factors; such as value, momentum, downside beta, and growth—appears limited, suggesting these factors play a relatively minor role in shaping the index’s return profile.
To read the complete report, kindly click on the provided link (or click here to view a PDF version). Additionally, please do not forget to subscribe to our latest news and research for the most relevant institutional insights on digital assets and the top digital assets by market cap.
The information contained within is for educational and informational purposes ONLY. It is not intended nor should it be considered an invitation or inducement to buy or sell any of the underlying instruments cited including but not limited to cryptoassets, financial instruments or any instruments that reference any index provided by CF Benchmarks Ltd. This communication is not intended to persuade or incite you to buy or sell security or securities noted within. Any commentary provided is the opinion of the author and should not be considered a personalised recommendation. Please contact your financial adviser or professional before making an investment decision.