
Five reasons to catch Weekly Index Highlights every Monday
Our Weekly Index Highlights series is designed to provide quick insights into crypto market events of the past week. Here’s a detailed look at what the series offers.
Our Weekly Index Highlights series is designed to provide quick insights into crypto market events of the past week. Here’s a detailed look at what the series offers.
CF Benchmarks’ Weekly Index Highlights, our series of concise crypto market summaries, was launched in early September, 2024.
Many market professionals have already discovered the benefits of having a trustworthy go-to source of unbiased commentary to hand every Monday, to quickly get up to speed with how digital assets fared the previous week.
And because their cadence is weekly, the highlights are easy to integrate into analyses of the broader market context institutional participants typically keep abreast of already.
Naturally, these weekly reports showcase CF Benchmarks’ high-integrity rules-based methodology; spanning single asset indices covering Bitcoin, Ethereum, Solana, Ripple and other large caps (the CME CF Single Asset Series); portfolios measuring whole market beta (the CF Capitalization Series); and indices focused more specifically on blockchain thematics (the CF Classification Series).
All told, our Weekly Index Highlights (WIH) are the only high frequency, quickly digestible read on cryptocurrency markets from a regulated Benchmark Administrator.
Weekly Index Highlights: A Closer Look
It's also worth noting Weekly Index Highlights are an integral part of CF Benchmarks’ complete research and content portfolio.
Our product, research and content teams have established a broad suite of publications, with each intended to supplement to the sum of the parts.
This enables a credible and comprehensive view of the investible digital asset market.
Below, we spotlight 5 key ways Weekly Index Highlights integrate into CF Benchmarks' broader suite of research content, providing an invaluable addition to any market monitoring routine.
- An impartial weekly view of the crypto market. As the first ever crypto Benchmark Administrator, regulated under UK and EU Benchmarks Regulation frameworks, CF Benchmarks’ market integrity is guaranteed by obligation. Meanwhile, the deep expertise of our practitioners in defining and measuring crypto prices, means our takes are second to none – but with no axe to grind.
- Lift the lid on Bitcoin’s credit market. We bring our track record of devising, publishing and administering the most institutionally trusted pricing sources to bear in calculation of the CF Bitcoin Interest Rate Curve (CF BIRC). This ensures all points on the curve are representative, replicable and resistant to manipulation. In turn, it means CF BIRC is the only curve that can meet the stringent standards institutional Bitcoin borrowers and lenders are subject to. WIH shows how these rates are moving over the short term.
- The only true measure of CME Bitcoin implied volatility. The CF Bitcoin Volatility Index Settlement Rate (BVXS) measures the implied volatility of the CME Bitcoin Options market, 30 days forwards. This makes BVXS the most accurate gauge of implied volatility in the primary Bitcoin options market that major institutions transact in. Weekly Index Highlights offer an invaluable view of implied volatility's impact on the BTC spot market.
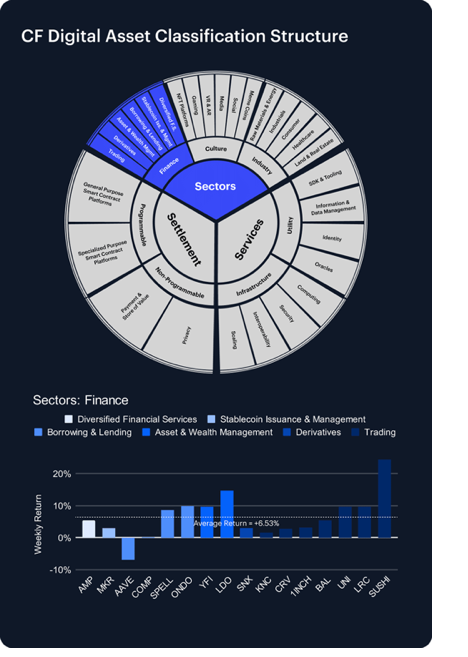
- A sneak peek at quarterly crypto drivers. Weekly Index Highlights include an animation of the CF Digital Asset Classification Structure (CF DACS), our unique digital asset taxonomy that delineates the investible crypto universe. CF DACS is increasingly used by institutional investors to demarcate the precise blockchain economic factors driving a portfolio, or the entire digital asset market. CF DACS animations enable an instant grasp of how these drivers are evolving. CF DACS is also an integral part of CF Benchmarks Quarterly Attribution Reports (QAR). Each QAR decomposes prevailing blockchain economic themes by determining the precise contribution of each CF DACS element on portfolio index returns.
- A snapshot of ETH staking rewards. Our research team commented on a surge in Ethereum network fees in their September Market Recap, observing that total fees jumped 89% month-on-month. That stands alongside the CF ETH Staking Reward Rate (ETH_SRR) summary in our September 30th Weekly Index Highlights; down -11.25% on the week, and -9.99 YTD. Collating the fee surge with ETH_SRR’s weekly collapse raises important questions. Like, whether ballooning fees incentivised increased validator participation, thinning out rates. It's an open question. But it does illustrate how each weekly sketch on ETH_SRR provides a valuable nugget of additional context.
Read all Weekly Index Highlights here.
The information contained within is for educational and informational purposes ONLY. It is not intended nor should it be considered an invitation or inducement to buy or sell any of the underlying instruments cited including but not limited to cryptoassets, financial instruments or any instruments that reference any index provided by CF Benchmarks Ltd. This communication is not intended to persuade or incite you to buy or sell security or securities noted within. Any commentary provided is the opinion of the author and should not be considered a personalised recommendation. Please contact your financial adviser or professional before making an investment decision.