CF Benchmarks Recap - Issue 12
Another week that Bitcoin failed to set an incremental new all-time high since notching a string of these in late November

-
Bitcoin's fade isn't all grey
-
XRP's Spark flame also fades
-
CME Group's classic take on the Bitcoin Reference Rate
 Getting colder
Fade continues
Bitcoin’s disinclination to ‘go in for the kill’ remained in the spotlight for a further week, extending the length of time BTC/USD has traded within c.$4,000 of the ‘psychological’ $20,000 price to a third week. It was also another week that Bitcoin failed to set an incremental new all-time high since notching a string of these in late November. A ‘technical analysis’ perspective isn’t required to interpret the change as indicative of deflating sentiment. Likewise, the Bitcoin Real-Time Index traded at approximately $17,948 at press time, a drop of some 8% from CF Bitcoin Reference Rate’s latest all-time high of $19,567.95, on 30th November. CF Benchmarks CEO Sui Chung noted that “There has been no real fundamental news to have driven the price”, underscoring that ‘sentiment’ rather than concrete events prevailed. Even if so, hard data continue to portray a market colour that isn’t negative overall. CryptoCompare’s tally of November spot trading volumes at exchanges it categorises as ‘high-tier’, rose 78% month-on-month, among the fastest paces ever. Not a record, though arguably more significant for the market and industry than a fabled round number.
MassMutual’s mass BTC buy
Continuing progress of the crypto market towards the mainstream further offset disappointment about price in some quarters of the market. Massachusetts Mutual Life Insurance Co., one of America’s oldest with possibly one of the most stuffiest names, purchased $100m in Bitcoin. It was part of a deal that saw MassMutual also invest $5m in Stone Ridge’s NYDIG unit. In the summer NYDIG created its own stir with an announcement of an $115m BTC purchase, lifting the firm’s custody of Bitcoin on behalf of clients to more than $1bn.
Spark airdrop ignites XRP
Despite a hyperactive year in crypto, major airdrops have been quite thin on the ground. That’s one reason for the buzz this week created by the promo strategy being deployed to push a token called Spark, by a network called Flare, targeting holders of XRP. At midnight UTC, on Saturday 12th December, Flare says it will take a snapshot of the XRP network as part of a plan to send Spark on a 1:1 basis to all XRP holders when the new network goes live in H1 2021. There are several more layers of complexity involved. What’s most salient for CF Benchmark’s XRP benchmark, however, is that this particular airdrop will not constitute a ‘distribution event’ with respect to XRP. It will therefore not directly impact XRP’s total return, nor market capitalisation. Details of our Airdrops policy can be found on page 21 of our Multi-Asset Series Ground Rules.
The Returns
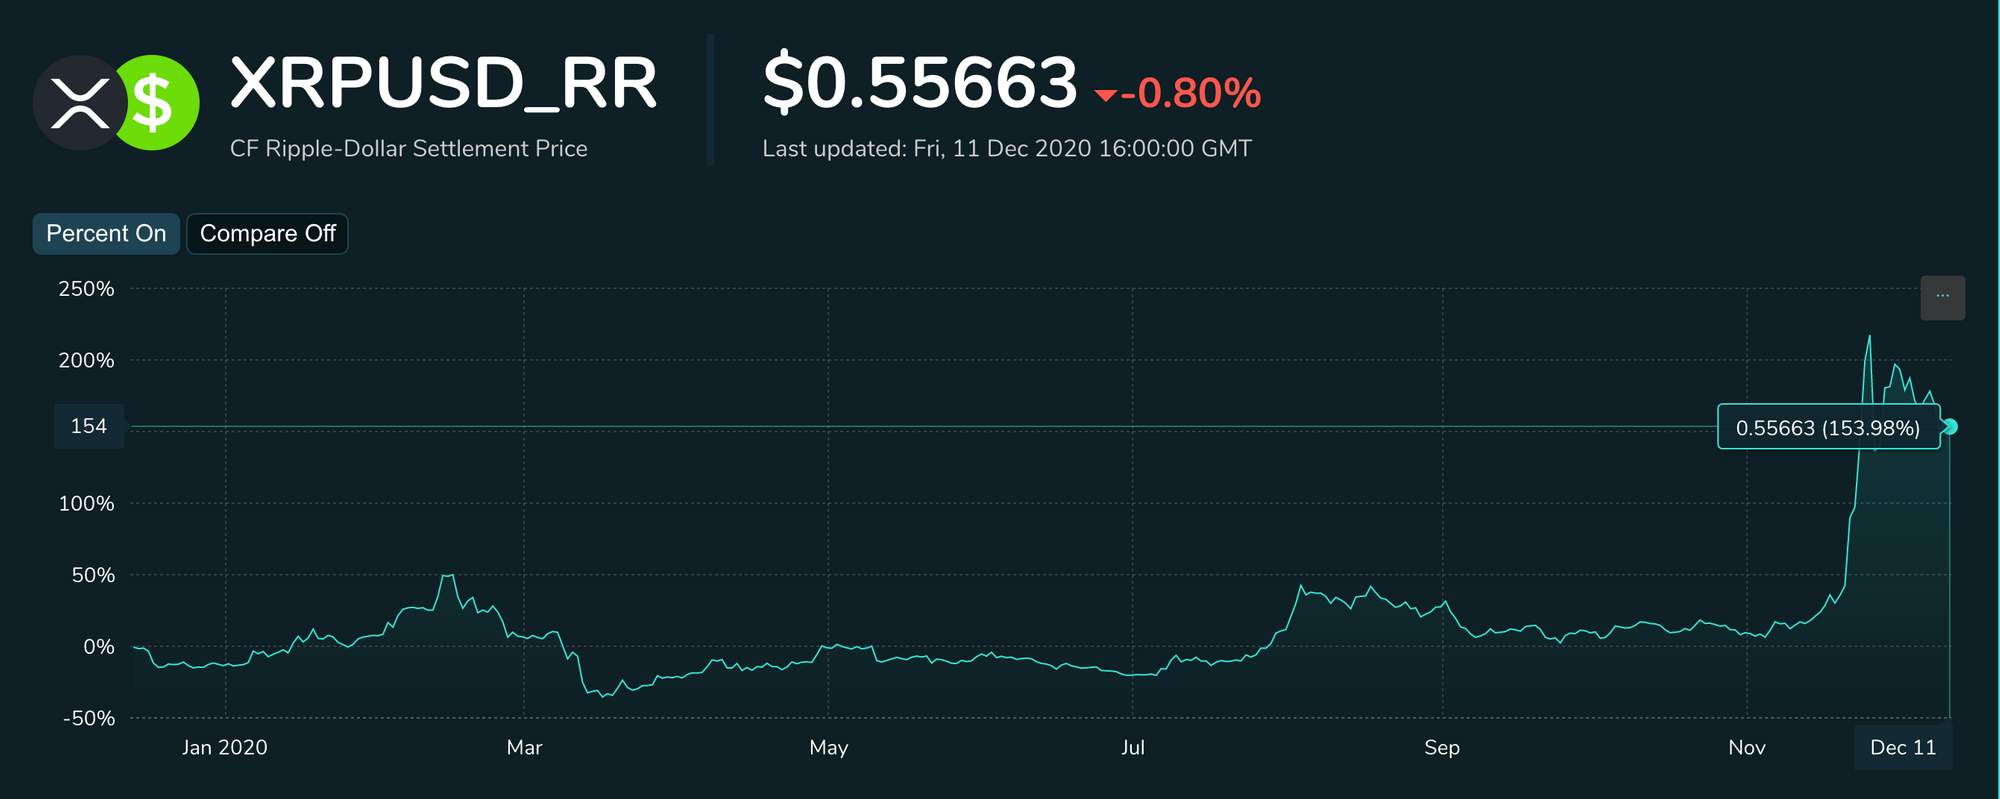
Predictably, regardless of airdrop subtleties, issues and complexities, XRP surged in recent weeks. Although airdrop news had circulated for months, XRP spiked most in November. CF Ripple-Dollar Settlement Price has in fact continued to retreat since peaking for the year on 24th November at $0.69699. The benchmark rate’s 2020 return currently sits at 153.98%.

Featured benchmark: CME CF Bitcoin Reference Rate
Analysis of CME CF Bitcoin Reference Rate
This week we re-publish a comprehensive examination of the CF Benchmarks Bitcoin benchmark by the CME Group
Originally published on 5th June 2019 on the CME Group’s website
By Payal Lakhani
1. Executive summary
Through the analysis that follows, it is possible to conclude that the BRR is representative of the underlying bitcoin spot market that it tracks, as by definition it represents the actual trades that have occurred within that market. By capturing the notional value of transactions, the BRR provides an accurate reference to the average spot price over the period.
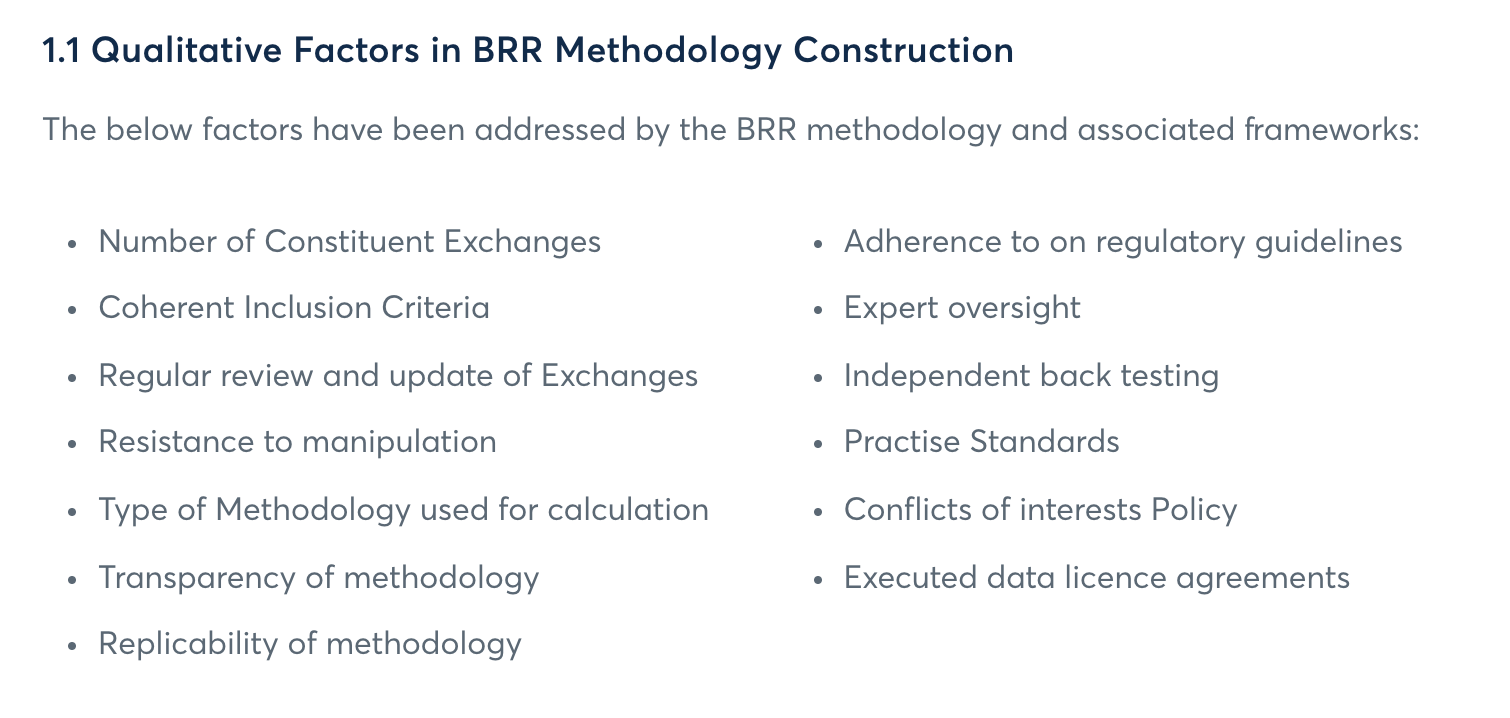
The design choices within the methodology makes the BRR highly resistant against manipulation. The use of medians reduces the effect of outlier prices on one or more exchange. The volume-weighting of medians filters out high numbers of small trades that may otherwise dominate a non-volume weighted median. The use of 12 non-weighted partitions assures that price information is sourced equally over the entire observation period. Influencing the BRR would therefore require trading activity during multiple partitions on several exchanges over an extended period, which would prove a costly and an operationally intensive undertaking.
There is sufficiency of data inputs for the calculation, and the data is provided under licencing arrangements with each exchange, who in turn meet strict entry criteria. The exchanges that are included within the calculation represent the underlying spot market and the trading on these venues account on average for over 50% of total BTC:USD volume.
There is liquidity in the BRR, in the 1 year to March 2019, over USD 3 billion worth of bitcoin trades were executed, over 1.8 million trades were included in the BRR based on a total of 607,000 bitcoins traded, this shows credibility in the computation of the BRR. The BRR is replicable, as a trader can replicate the BRR by trading bitcoin on any of the constituent exchange(s) where the price is trading close to the median. The ability to replicate the BRR assures that the index appropriately tracks the price of bitcoin at the constituent exchanges.
To maintain its integrity, the index’s development relied on recognized best principles for financial benchmarks. Furthermore, an expert oversight committee is responsible for overseeing the scope of the index by approving and regularly reviewing the calculation methodology, practice, standards and definition of the reference rate to ensure it remains relevant and robust. A clear policy has also been established against which any hard fork can be evaluated to determine its significance, as well as a set of pre-defined criteria to govern the course of action to be taken should a hard fork occur.

Read the rest of this article on the CME Group website
The information contained within is for educational and informational purposes ONLY. It is not intended nor should it be considered an invitation or inducement to buy or sell any of the underlying instruments cited including but not limited to cryptoassets, financial instruments or any instruments that reference any index provided by CF Benchmarks Ltd. This communication is not intended to persuade or incite you to buy or sell security or securities noted within. Any commentary provided is the opinion of the author and should not be considered a personalised recommendation. Please contact your financial adviser or professional before making an investment decision.

