
CF Benchmarks Quarterly Attribution Reports - September 2025
Thoroughly dissect and comprehend the performance of our flagship portfolio indices at the constituent, category, sub-category, and segment levels during the course of each portfolio rebalance period.

Policy Progress Drives Record Flows as Institutional Growth Meets Macro Reality
The latest rebalance period left digital assets navigating between inflation pressures, trade frictions, and record institutional inflows, as macro headwinds alternated with policy tailwinds. June opened on a defensive footing, with Bitcoin consolidating in the six-figure range as the Federal Reserve continued to hold rates steady, signaling persistent concern about sticky inflation. Yet regulatory momentum offered support: the GENIUS stablecoin bill advanced through the Senate, while the SEC cleared filings for staking-enabled Solana ETFs and multi-token baskets, further reinforcing the steady integration of digital assets into regulated markets. Momentum accelerated in July as spot Bitcoin and Ether ETFs absorbed more than $10 billion, setting a new monthly record. CME futures activity reached all-time highs across Ether, Solana, and XRP, while regulatory clarity deepened through the SEC's approval of in-kind redemptions, exchanged-proposed listing standards, and the White House's release of a comprehensive digital asset roadmap. President Trump's signing of the GENIUS Act into law further institutionalized the space, with capital increasingly flowing toward scalable and liquid products.
By August, however, hotter-than-expected PCE data revived inflation concerns while Bitcoin ETF's posted their first monthly outflows since March. Yet institutional demand broadened beyond Bitcoin: Ether ETFs continued attracting inflows, while XRP futures became the fastest CME contract to surpass $1 billion in open interest. Importantly, even amid negative Bitcoin returns during this period, volatility remained near historic lows, pointing to more mature market structure. Taken together, the quarter underscored a dual narrative: lingering vulnerability to policy and liquidity shifts alongside accelerating institutional adoption. Bitcoin's breakout to new all-time highs cemented its role as a macro hedge, while Ether, Solana, and XRP highlighted the widening institutional opportunity set. With performance leadership starting broaden, the foundations are being laid for a more durable market expansion.
Key takeaways:
Digital Assets See Expanding Breadth
- Following a quarter defined by record ETF flows, landmark legislation, and regulatory breakthroughs, the digital asset market entered the latest rebalance period on stronger footing. The interplay of persistent inflation signals with accelerating institutional adoption created an environment where large-cap resilience was complemented by sector-specific leadership
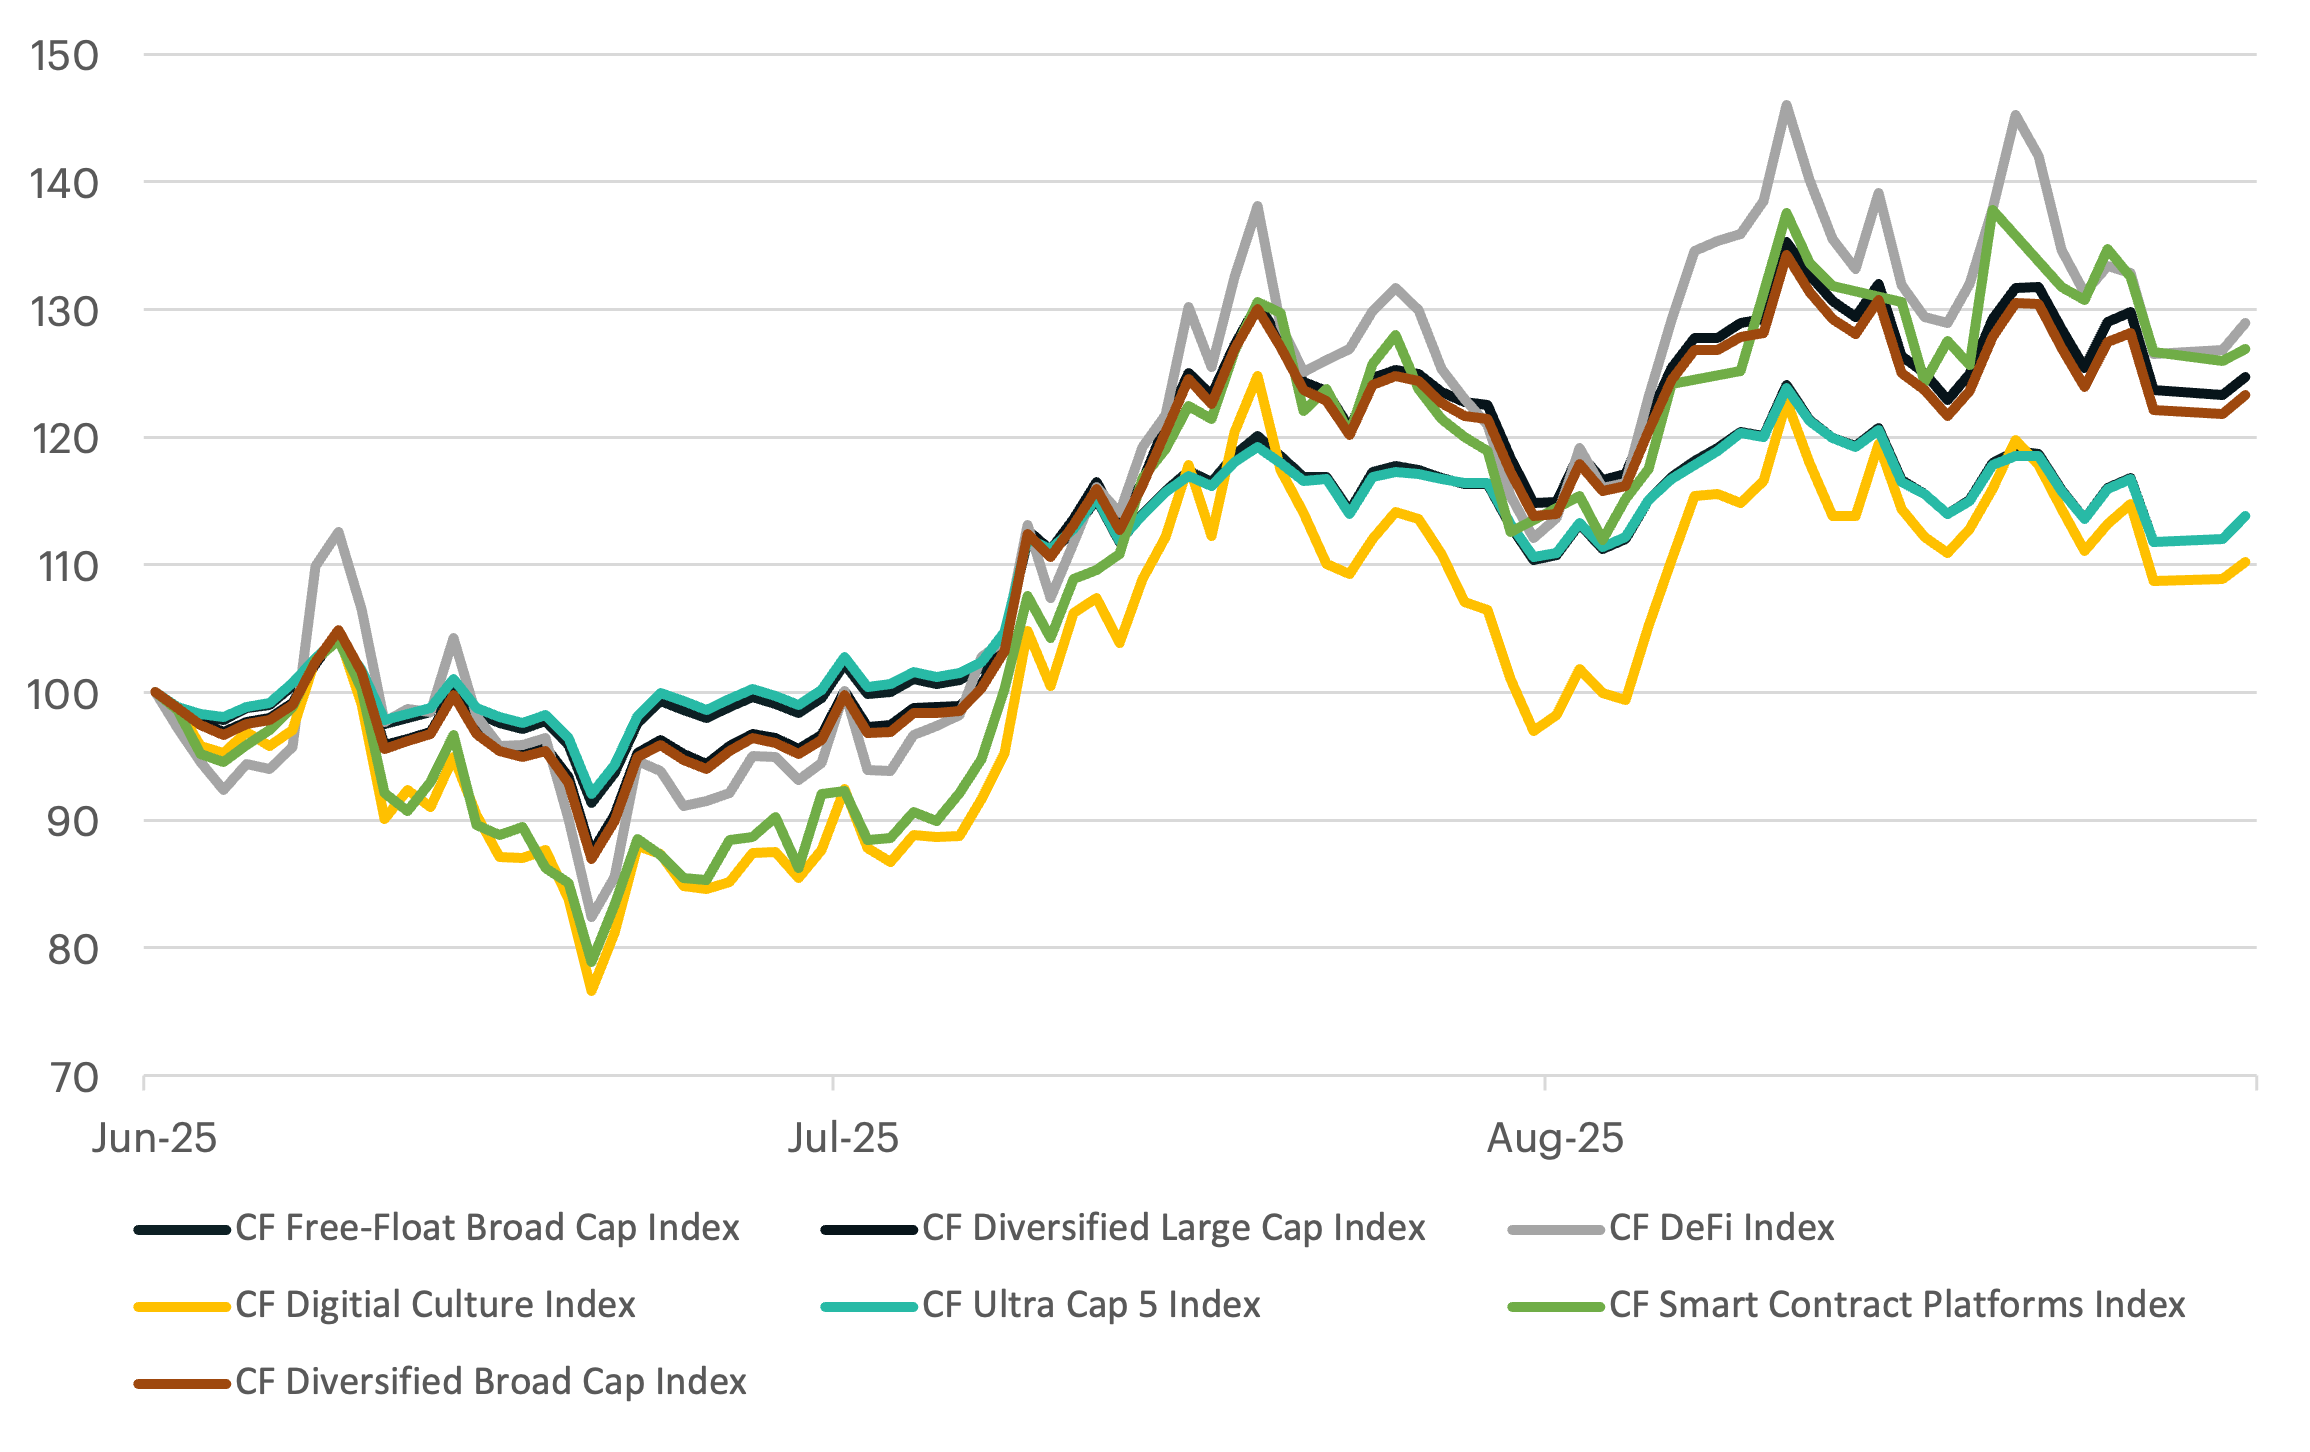
- The CF Diversified Large Cap Index (+23.9%), CF Diversified Broad Cap Index (+21.8%), CF Free-Float Broad Cap Index (+12%), and CF Cryptocurrency Ultra Cap 5 Index (+12%) all registered gains, underscoring broad participation during the quarter.
- The CF Web 3.0 Smart Contract Platforms Index and the CF DeFi Composite Index each surged by 26.8%, on the back of Ethereum’s outsized gain, while the CF Digital Culture Composite Index advanced a more modest 8.9%, as gaming tokens faced persistent headwinds.
Normalized Index Performance
Altcoin Rotation Signals More Participation
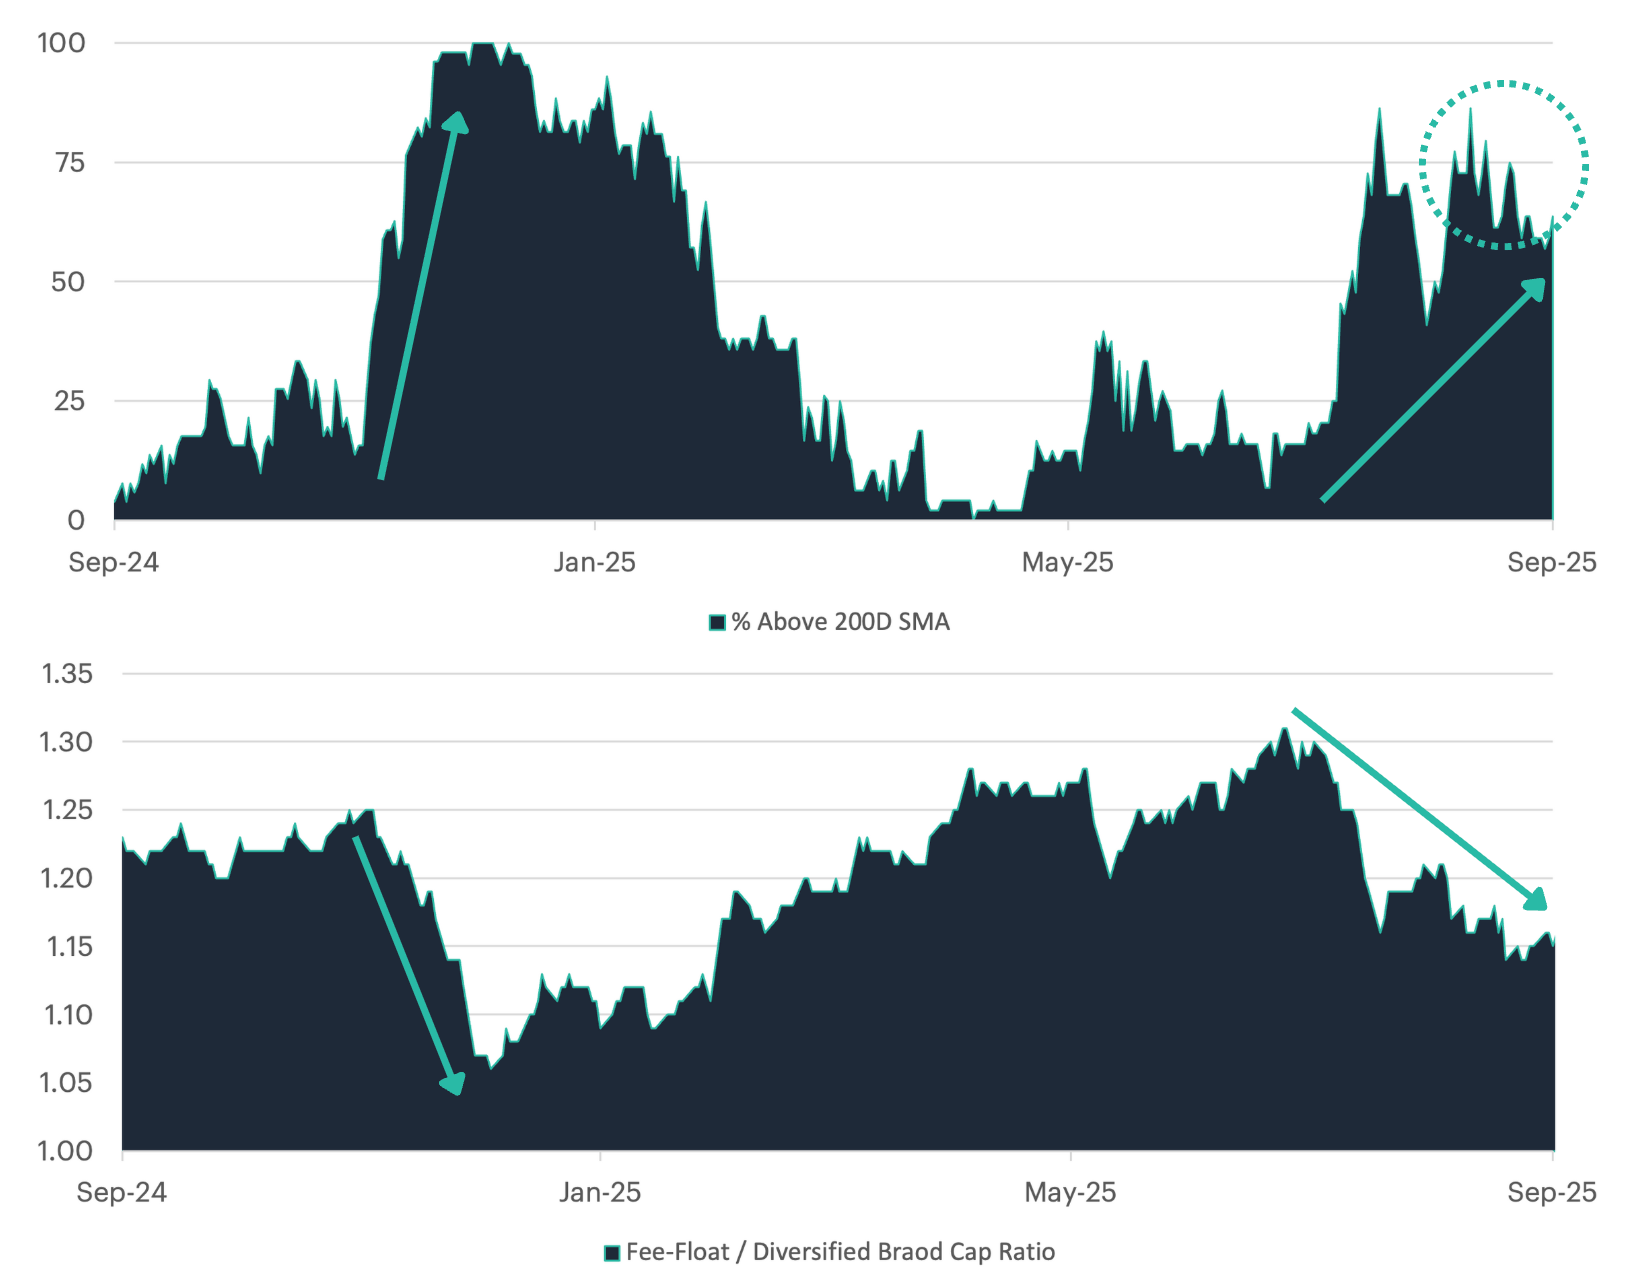
The relative performance between the CF Free-Float and Diversified Broad Cap Indices serves as a useful proxy for altcoin participation. The free-float index is dominated by Bitcoin and Ether, while the diversified version allocates greater weight to mid- and smaller-cap tokens. Over the most recent period, the diversified index has outperformed the free-float variant to nearly the same degree as during the post-election rally last November. This underscores how capital rotation into the broader market is beginning to reassert itself, suggesting that investor appetite is no longer confined solely to mega-caps but is gradually extending into secondary assets.
Market breadth, measured by the share of tokens trading above their 200-day moving average, provides another lens for gauging this rotation. Interestingly, while the diversified index has pulled ahead of the free-float benchmark, breadth has been declining since July. This apparent disconnect reflects the fact that Ether's outsized rally has delivered the bulk of the diversified index's relative gains, while most other constituents have failed to keep pace. In other words, performance is broadening at the index level but not yet at the individual token level. This dynamic leaves open the possibility that "altcoin season" has further room to run. With many constituents still trading below long-term technical thresholds, there is scope for a broader catch-up phase if macro conditions remain supportive and flows continue to deepen.
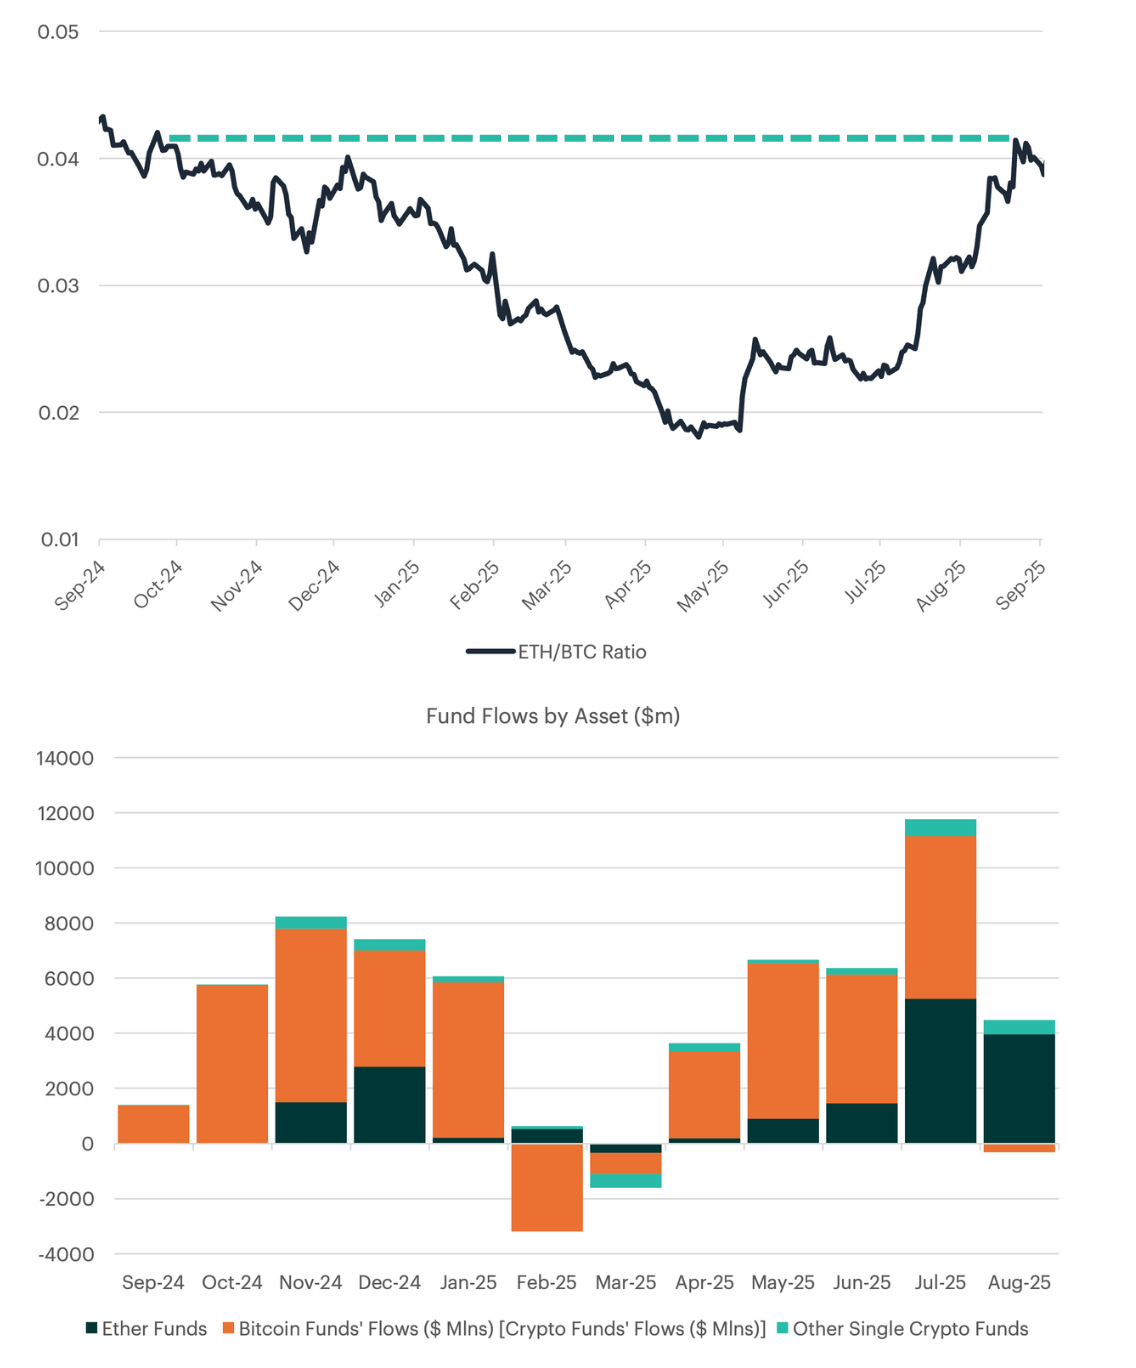
ETH Breakout: Fund Flows to Corporate Treasuries
The ETH/BTC ratio broke out to its highest level since October 2024, underscoring Ether's relative price momentum. Spot Ether fund flows have totaled more than $12 billion year-to-date, and while trailing Bitcoin's roughly $20 billion, ETH inflows have begun outpacing BTC in recent months. This surge drove ETH to a new all-time high near $4,900 in August, supported by its 10th anniversary, protocol upgrades, and expanding activity across tokenization, staking, DeFi, and Layer 2 solutions.
Beyond fund flows, Ethereum's growing role in corporate treasuries has created continuous institutional demand. While Bitcoin dominates balance sheets, crypto-native firms, DAOs, and public companies are increasingly adding ETH for direct ecosystem exposure. This treasury adoption trend, highlighted in our Q3 Market Outlook under "Measuring Corporate Adoption: A Balance Sheet Unlock", has become a critical performance driver.
Corporate digital asset adoption is rapidly expanding, with two models having emerged: purpose-built treasury companies and operating companies allocating smaller portions for diversification. This approach has delivered outsized returns and established a template extending beyond Bitcoin. Ethereum is emerging as the next beneficiary. With stablecoins going mainstream and growing use cases for staking and collateralization, corporations are strategically accumulating ETH. This treasury bid has been instrumental in propelling ETH to new highs and driving the ratio breakout, validating Ethereum's evolution into a core institutional-grade asset alongside Bitcoin.
Large-Cap Altcoins Rise Amid Record-Low Volatility
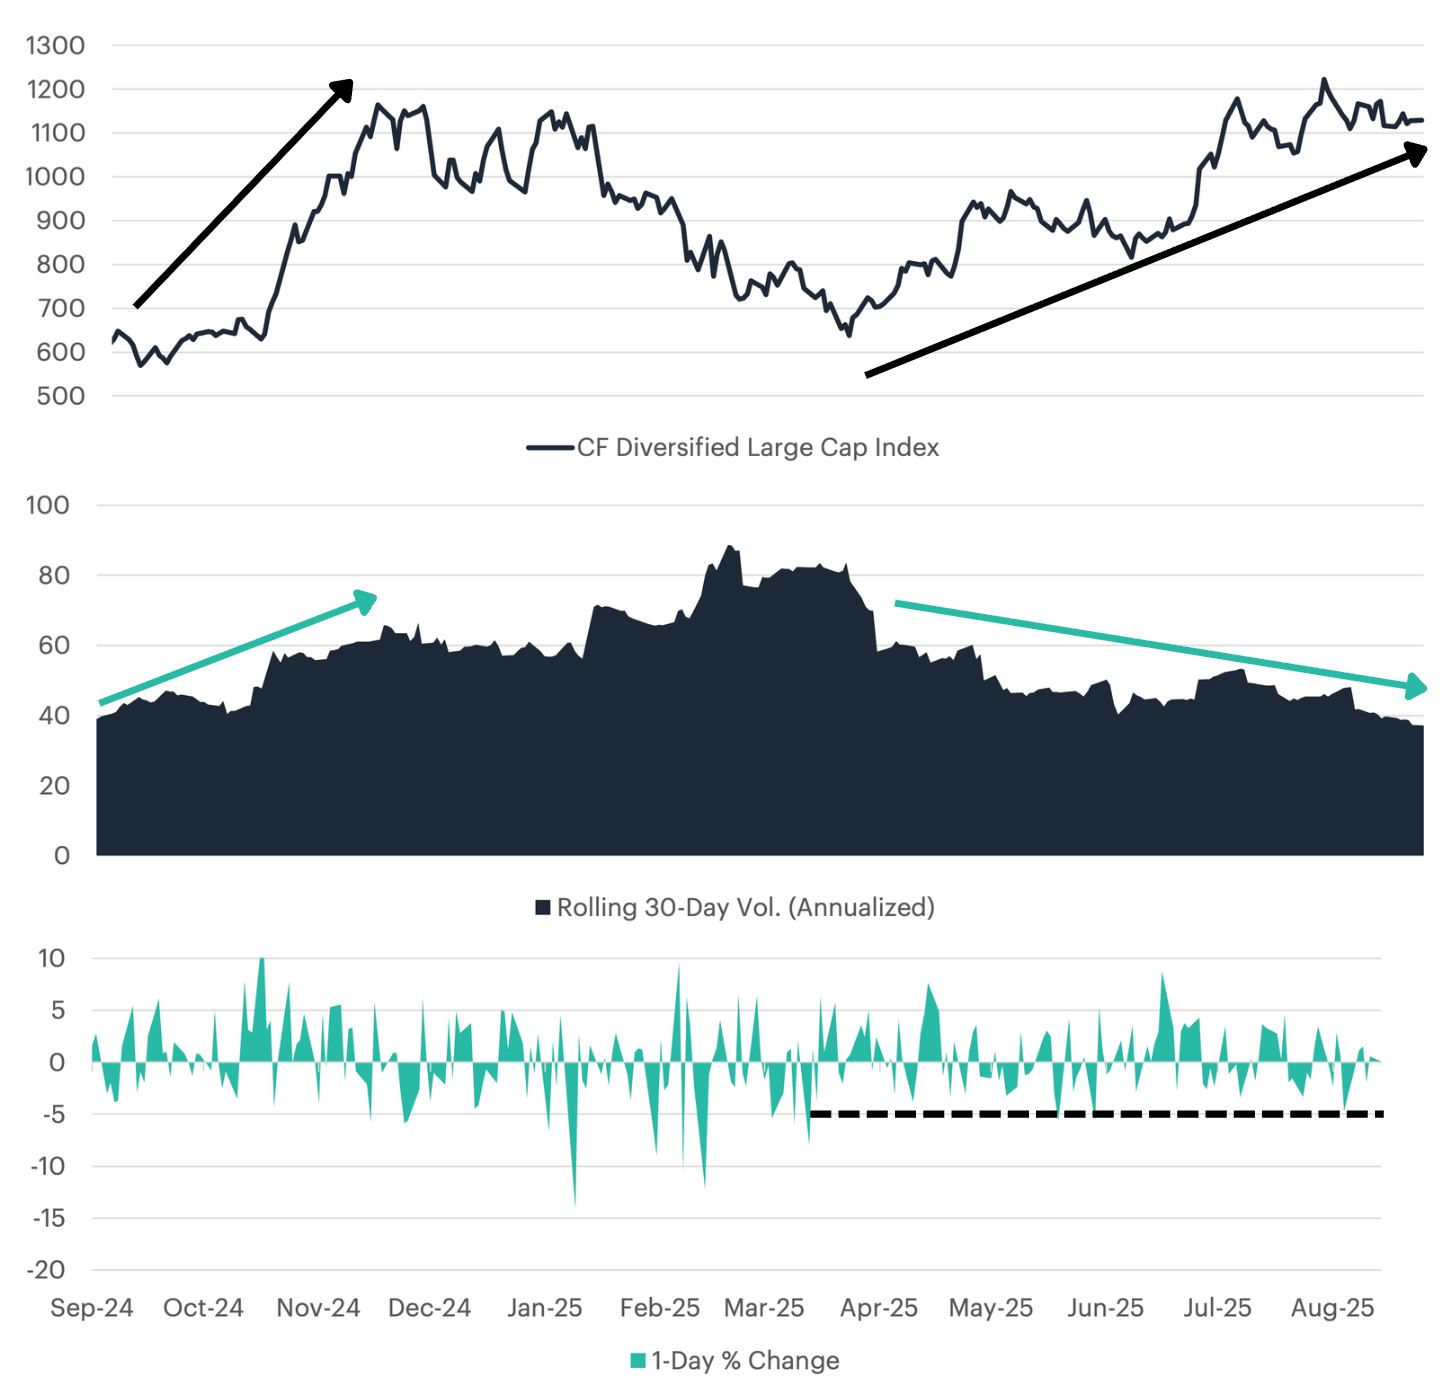
The CF Diversified Large Cap Index has shown a notable divergence between price strength and realized volatility. Since late June, prices have advanced steadily, pushing the index to sustained highs, while volatility has trended sharply lower. This divergence underscores the market's transition into a low-volatility regime, a rare phase for digital assets.
Much has been written about Bitcoin's volatility falling to all-time lows, but less appreciated is that large-cap altcoins are following a similar trajectory. Rolling 30-day annualized volatility has compressed to levels not seen since early 2024, and importantly, this drawdown in volatility has coincided with improving price action rather than weakness. Daily return data confirm this dynamic: despite the index rally, there have been no one-day losses exceeding 5% during this recent advance, a stark contrast to the sharp swings that characterized earlier phases of the cycle.
For investors, this environment has materially boosted risk-adjusted returns across the asset class. Sharpe ratios have improved as prices grind higher on muted volatility, reinforcing institutional confidence in the durability of the rally. While periods of calm rarely persist indefinitely, the current structure suggests large-cap digital assets are becoming increasingly investable within diversified multi-asset portfolios.
Uniswap Rallies as v4 Adoption Accelerates
During the past quarter, Uniswap v4 has cemented its position as a major growth driver for the protocol, supported by rapid adoption. V4 introduces hooks, singleton architecture, and flash accounting, all of which improve efficiency, reduce costs, and enable programmable markets. These features have attracted liquidity providers and developers to build bespoke pools, particularly for stablecoin trading and Layer-2 routing, where efficiency gains are most pronounced.
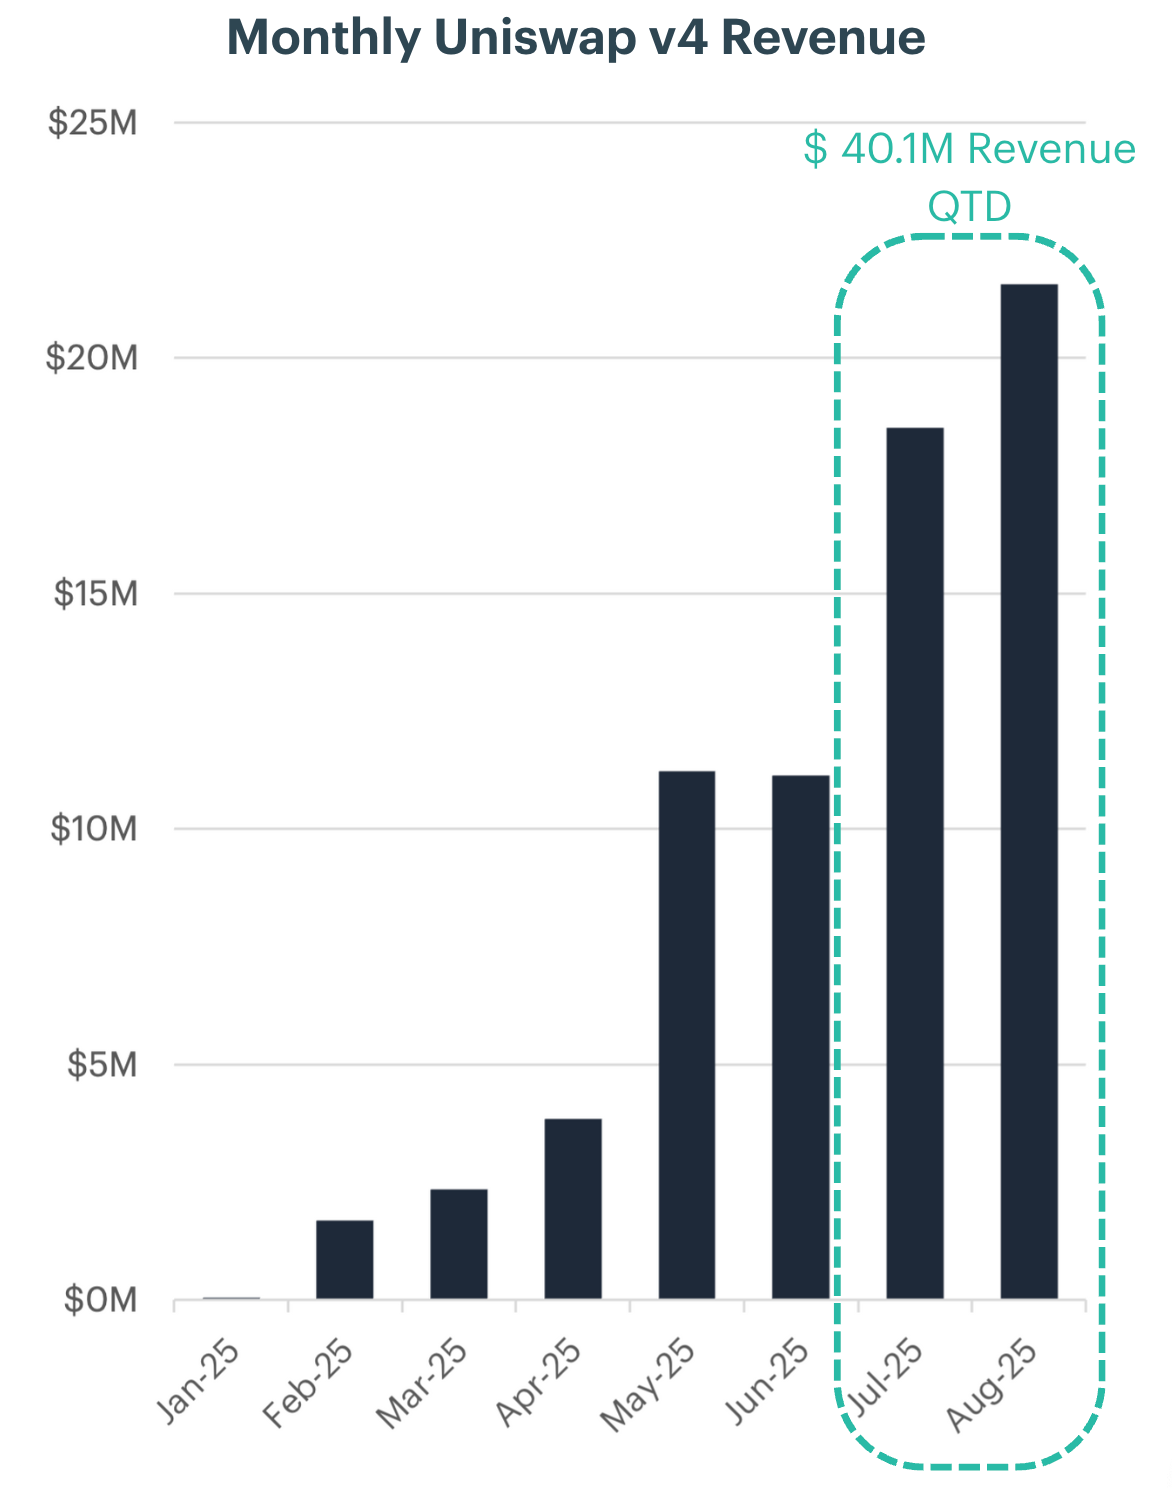
Fee generation illustrates this impact clearly. In August, Uniswap v4 produced $21.6 million in protocol fees, a new high and nearly double June’s level. Looking at quarterly dynamics, fees grew from just $4.1 million in Q1 2025 to $26.2 million in Q2, a 542% increase quarter-over-quarter. Based on July and August alone, Q3 fees have already reached $40.1 million, putting the protocol on pace for more than 50% QoQ growth versus Q2. This trajectory demonstrates not only surging usage but also the stickiness of new strategies enabled by hooks and improved pool design.
In the most recent rebalance period, investors appeared to take note, with the price of the UNI token rallying nearly 40%. Rising fee revenue on v4 signals durable demand for improvements in on-chain trading and underscores Uniswap’s leadership position. Governance discussions around a potential fee switch, which would direct a share of protocol revenues to the treasury or token holders, have further bolstered investor optimism. Taken together, accelerating fee generation and the prospect of clearer value accrual to UNI create a supportive backdrop for Uniswap as it remains one of the most widely used DeFi protocols.
Arbitrum Gains Momentum Among Layer-2s
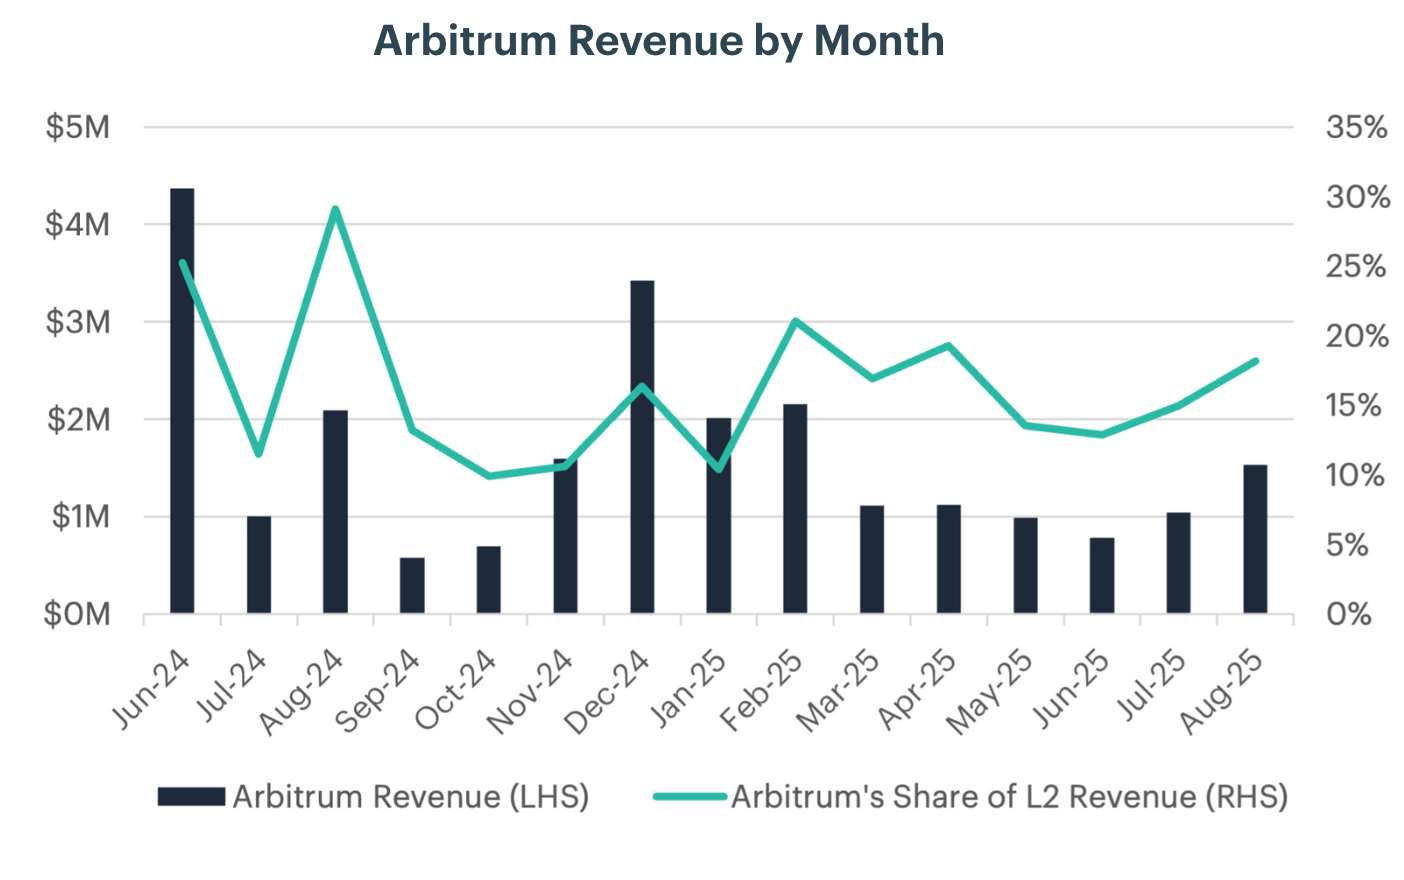
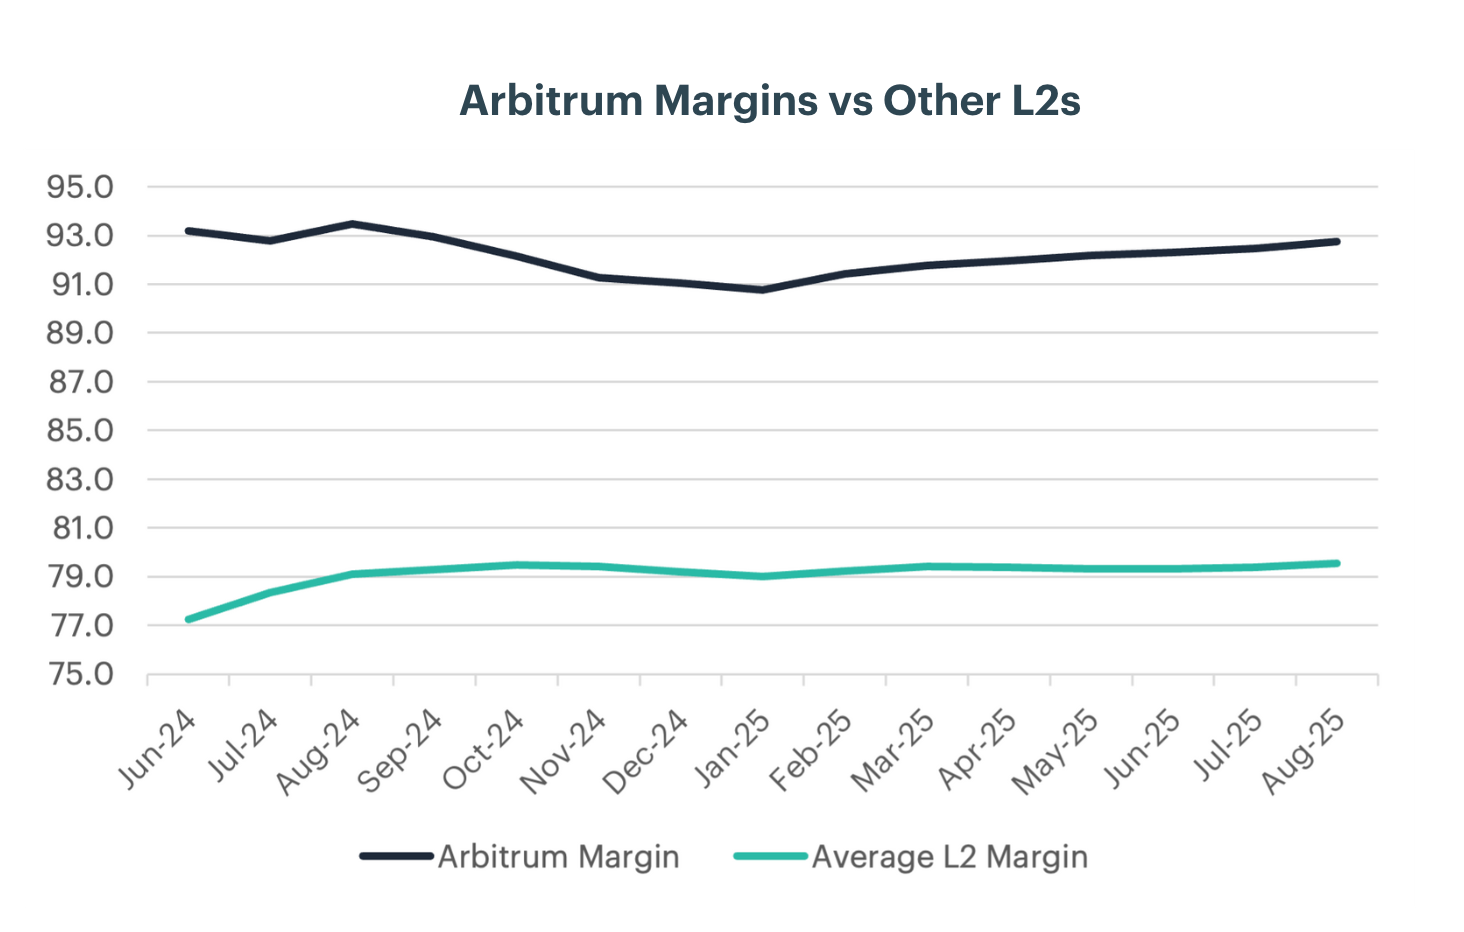
Arbitrum’s performance this quarter was underpinned by a steady rebound in its share of Layer-2 revenue, with recent months marking higher lows and a gradual climb back to 18% in August. This recovery in market share reflects strengthening activity across its ecosystem, supported by incentive programs and new DeFi deployments. On a quarterly basis, the improvement is clear: Q2 2025 revenues totaled $2.9M, but in just the first two months of Q3 Arbitrum has already generated $2.5M, putting it firmly on pace to surpass the prior quarter. Importantly, this growth comes alongside consistently high profitability. Arbitrum’s margins have remained above 92%, far outpacing the Layer-2 average of around 79%, underscoring its structural efficiency and cost advantage. The combination of rising on-chain activity and newly launched incentive programs has created strong demand for the ARB token, helping to drive a 32.7% gain during the quarter.
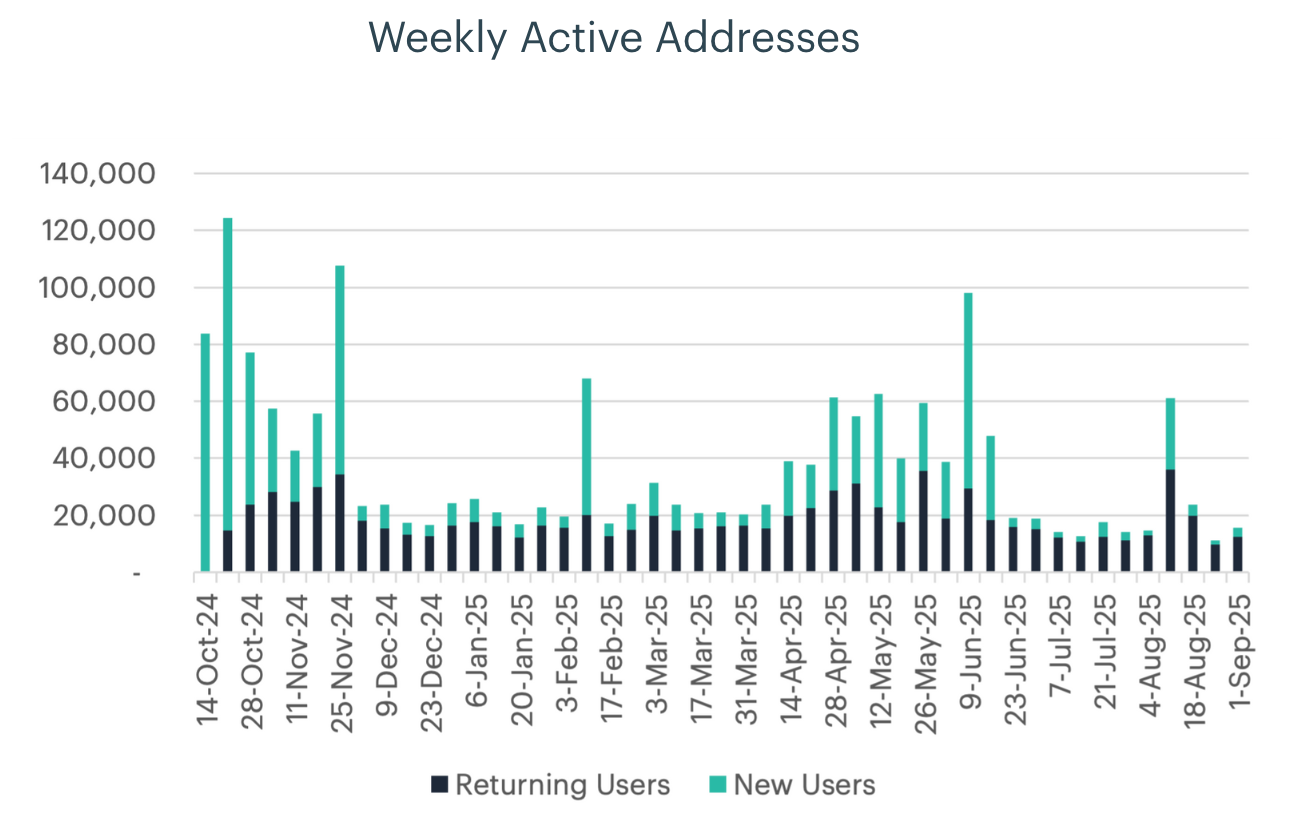
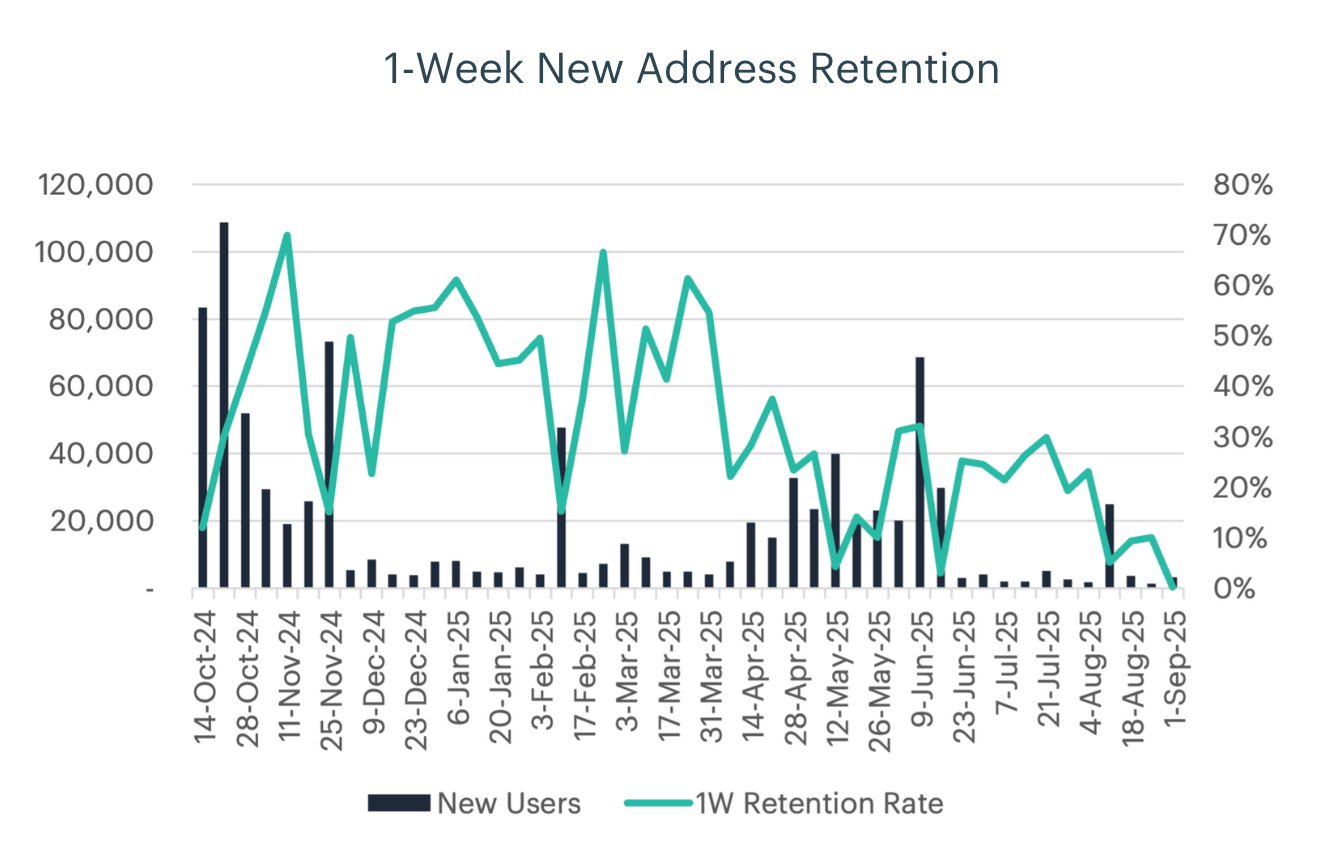
Apechain Fails to Retain New Users in Q3
ApeChain’s momentum cooled over the past quarter as both user growth and retention weakened. Weekly active addresses highlight the trend: after peaking at nearly 69,000 new users in early June, that growth declined sharply to just 3,200 by September 1, a drop of more than 95%. Returning users have provided some baseline activity, but overall engagement is clearly lower. Retention data reinforced the challenge, with 1-week retention rates slipping from consistent 20–40% levels earlier in the year to the single digits by late summer. This points to continued difficulty in converting initial bursts of new users into sustained participation.
Despite the launch of ApeChain as Yuga Labs’ dedicated gaming and metaverse chain, broader adoption remains uneven. Token unlocks and the governance shift from the ApeCoin DAO to a corporate structure added further uncertainty, limiting demand for APE and raising questions around ApeChain’s ability to build sticky, long-term usage.
To read the full report , please click on the respective links below:
Quarterly Attribution Report (PDF Version)
Lastly, our Quarterly Attribution Reports are designed to help investors understand the performance of digital assets through a purpose-centric lens called the CF Digital Asset Classification Structure (CF DACS). To learn more about CF DACS, please utilize our interactive CF DACS Token Explorer.
Contact Us
Have a question or would like to chat? If so, please drop us a line to:
info@cfbenchmarks.com
The information contained within is for educational and informational purposes ONLY. It is not intended nor should it be considered an invitation or inducement to buy or sell any of the underlying instruments cited including but not limited to cryptoassets, financial instruments or any instruments that reference any index provided by CF Benchmarks Ltd. This communication is not intended to persuade or incite you to buy or sell security or securities noted within. Any commentary provided is the opinion of the author and should not be considered a personalised recommendation. Please contact your financial adviser or professional before making an investment decision.